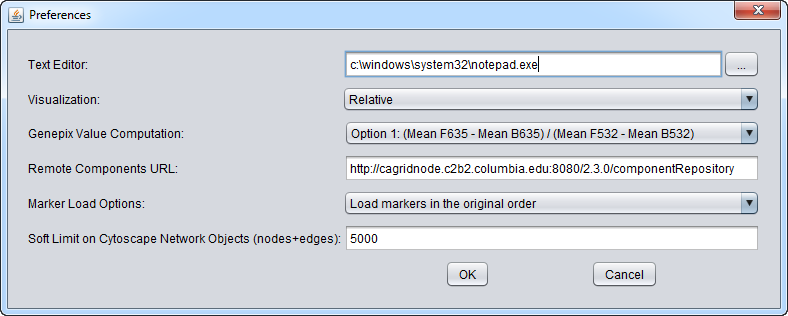
Preferences
Contents
Introduction
The Preferences item in the menu bar allows a number of features of geWorkbench to be configured.
Text Editor
The user can change the default text editor used to view data files. For example, when you right-click on a data node in the Project Folders component, "View in Editor" is one of the options offered.
Visualization
Heat maps, e.g. in the Color Mosaic component, can be displayed using either a relative or an absolute color scheme.
Note - Changing the relative/absolute preference will not take effect until the next time a data set is loaded.
- Absolute
- Red represents positive expression values, and green represents negative expression values. Black represents a value of zero. The shade represents the expression magnitude as follows:
- Formal spec: Let M = max{|min|, |max|} over all expression measurements, across all arrays. If expression value x > 0, assign it the red spectrum x / M * 256. If expression value x is negative, assign it to the green spectrum -x / M * 256.
- Relative (default)
- Relative is similar to the setting for Absolute, but each marker is mean-variance normalized first. A Red-Blue color scheme is used, with red representing the highest values and blue the lowest. White represents the marker average.
- Note - Relative will give odd-looking results if only a small number of arrays are loaded.
GenePix Value Computation
Four methods for calculating a composite expression measurement for each marker in a GenePix file are offered. They combine the foreground and background and mean or median measurements from each channel in different ways.
- ( F635 Mean - B635 Mean) / (F532 Mean - B532 Mean).
- ( F635 Median - B635 Median) / (F532 Median - B532 Median).
- ( F532 Mean - B532 Mean) / (F635 Mean - B635 Mean).
- ( F532 Median - B532 Median) / (F635 Median - B635 Median).
See the entry GenePix Format in the GenePix tutorial chapter for further details of processing GenePix data on input.
Remote Components URL
geWorkbench can download certain components from a network repository. This specifies the location of the network component repository.

