ANOVA
Contents
Overview
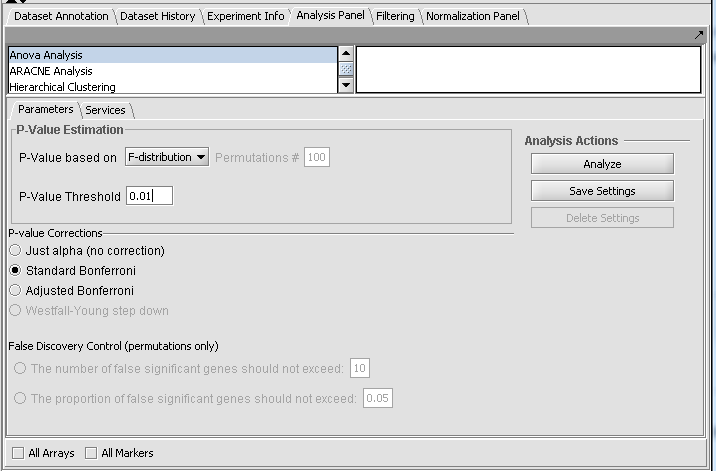
The geWorkbench ANOVA component utilizes a one-way analysis of variance calculation from TIGR's MEV package. At least three groups of arrays must be specified by defining and activating them in the Arrays/Phenotypes component. For each chosen marker the routine determines if, at the specified level of significance, any difference exists in expression values between any of the groups (the null hypothesis is that there is no difference between the groups). Several basic methods of multiple testing correction are offered. The analysis does not indicate between which groups the difference is found, only that one exists.
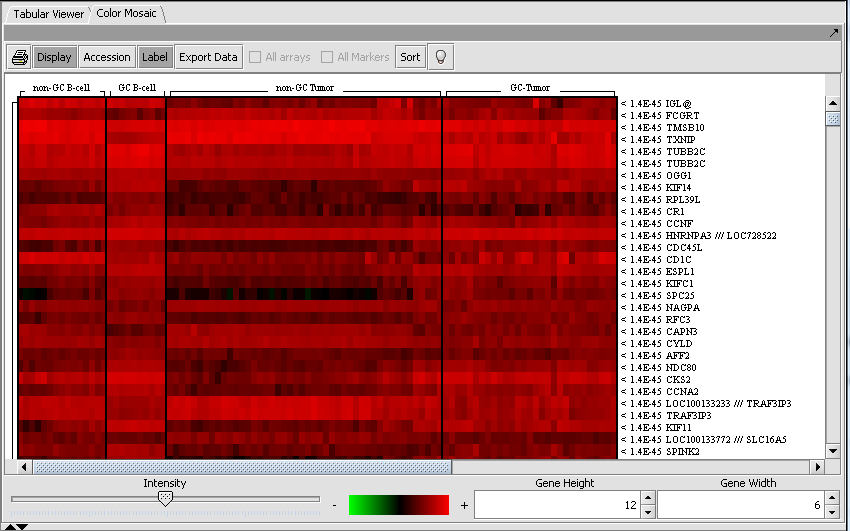
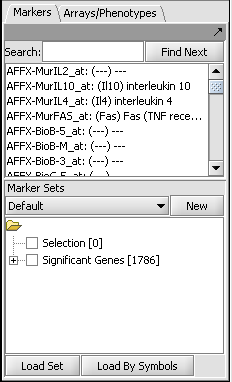
Those markers for which a significant difference is found are placed into a new set in the Markers component called "Significant Genes". The results are also display as a heat map in the Color Mosaic component.
Loading the example data
This example uses the Bcell-100.zip available and further described on the Download page. Briefly, this dataset is composed of 100 Affymetrix HG-U95Av2 arrays on which various B-cell lines, both normal and cancerous, were analyzed. Thus it explores a potentially wide variety of expression phenotypes. In order to see the gene names associated with the probesets, one must also download the correct annotation file for this array from the Affymetrix Netaffx website.
- Obtain the Bcell-100.exp dataset. If downloaded as a zip file, unzip it to a convenient directory.
- (Optional) Obtain the annotation file for the HG-U95Av2 array type from Affymetrix. The name will be similar to "HG_U95Av2.na28.annot.csv", where na28 is the version number.
- Load the Bcell-100.exp dataset into geWorkbench as type "Affymetrix File Matrix". (See Loading from File).
- When prompted, and if desired, load the annotation file.
Choosing array groups
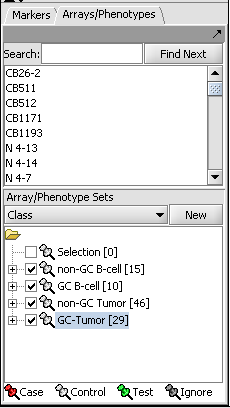
The Bcell-100 dataset comes with predefined sets of arrays. In the Arrays/Phenotypes component (at lower left in the geWorkbench GUI), choose the group in the pulldown menu called "Class". Check each of the four sets of arrays to activate them as shown in the figure below.
Setting up ANOVA Parameters
ANOVA result display


