ARACNe
A new ARACNE tutorial is coming soon....
ARACNE in geWorkbench is used to determine interactions between a hub gene and a set of selected genes (or all genes in the set).
Contents
- 1 Quick Example
- 1.1 ARACNE
- 1.2 Run ARACNE
- 1.3 <a name="_Parameters"></a> Parameters
- 1.4 <img src="aracne_files/T_ARACNE_parameters.png" width="736" height="351">
- 1.5
- 1.6 Bootstrapping
- 1.7 <a name="_View_Arance_Results"></a>View Arance
- 1.8 <img border="0" width="855" height="551" src="aracne_files/image002.png">
- 1.9 Selecting markers back into the Markers component in Cytoscape:
- 1.10 References
Quick Example
- Load a microarray dataset, e.g. Bcell-100.exp.
- Set a hub gene (e.g 1973_s_at)
- Click Analyze.
The resulting adjancency matrix will be displayed in the Cytoscape network visualization component.
ARACNE
ARACNE (Algorithm for the Reconstruction of Accurate Cellular Networks) is an information-theoretic algorithm used to identify transcriptional interactions between gene products using microarray expression profile data. The resulting network is displayed using the Cytoscape component. ARACNE can be used to predict potential functional associations among genes, or to predict novel functions for uncharacterized genes, by identifying statistical dependencies between genes. The results take the form of a matrix of candidate interactions, also called an adjacency matrix, which can be used for further network visualization and analysis. This help topic describes <a href="#_Run_Aracne">executing ARACNE</a> and <a href="#_View_Arance_Results">viewing the results</a>.
ARACNE can perform two separate calculations:
1. Mutual Information: The mutual information (MI) of one or more marker's expression profile(s) is calculated against all other active markers.
2. Data Processing Inequality (DPI): The DPI calculation (triangle inequality) is used to remove the weakest interaction (edge) between any three markers. That is, if a MI value is available between each of three possible pairings of three markers, the weakest interaction of the three will be removed from the output. This has the intent of removing indirect interactions. For example, if A->B->C, the interaction A->C is indirect and would be removed.
Parameters described below allow one to incorporate a list of putative transcription factors and optimize the run to discover targets that they may regulate.
<a name="_Run_Aracne"> </a>
Run ARACNE
1. Load or select a microarray data set, or select an existing adjacency matrix in the project folders area of geWorkbench.
2. In the analysis pane (lower right), select ARACNE analysis from the analysis list.
3. Populate the <a href="#_Parameters">parameters</a> used for this analysis method.
4. Select the location to run the analysis (local or Grid) in the service sub-tab.
5. Click on Analyze. If successful, the resulting adjancency matrix is added to the Project Folders component as a child of its parent dataset. The Dataset history captures the analysis parameters.
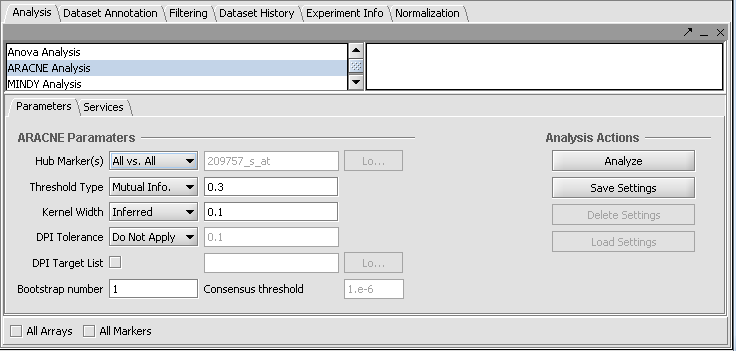
<a name="_Parameters"></a> Parameters
<img src="aracne_files/T_ARACNE_parameters.png" width="736" height="351">
- Hub Marker(s): Specifies which gene markers will be included in the the ARACNE mutual information (MI) calculation.
- "All vs All" comparison computes the mutual information for each marker's gene expression profile against all others,
- "List" compares the members of a user-entered list of marker expression profiles (these being called "Hub Markers") against all other expression profiles in the datast. A comma-separated list of marker IDs can be typed directly into the component, or the list can be loaded from a CSV file by clicking Load.
 When Hub Marker "All vs All" is selected, the text field is grayed out.
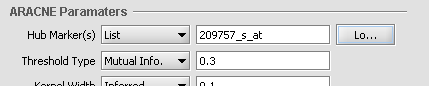 When Hub Marker "List" is selected, one can type the list into the text box.


- Threshold Type: This drop-down specifies the type of threshold to be used and can take the values “Mutual Info” or “P-value”. The actual value entered into the adjacent text area is always a number between 0 and 1.
- Kernel width: The kernel width used for the computation of the MI values. The Kernel width is a scaling parameter used when fitting a Gaussian function to the data. This can be either inferred by the application (select Inferred) or entered explicitly by the user (select Specify).
- DPI Tolerance: The Data Processing Inequality (triangle inequality) can be used to remove the weakest interaction of those between any three markers. The tolerance setting is necessary due to the imprecision of the DPI calculation when using a finite amount of data.
- If the “Do Not Apply” option is specified, no DPI is applied.
- If the “Apply” option is selected then the DPI is applied and the value (between 0 and 1) in the associated text box is used to determine the stringency level of the DPI application.
- DPI Target List: If the box is checked, the user selects and loads a file which specifies markers (which should be a list of one or more presumptive transcription factors) which will be given preferential treatment during the DPI edge-removal step. Edges originating from markers on this list will not be removed by edges originating from markers not on this list. This can compensate e.g. for the effects of very tight transcriptional correlation between genes that are not involved in regulation, e.g. they may be involved in producing proteins for a macromolecular complex. However, for DPI calculations where all three markers are members of the list, the weakest connecting edge may still be removed.
- All Markers: checking this box overrides any activated set markers in the Markers component for inclusion in the pairwise MI calculations. If a marker set is activated, only the markers in the set will be used. In addition, if NO marker sets are activated, all markers will be used.
- All Arrays: checking this box overrides any activated set arrays in the Arrays/Phenotypes component for inclusion in the MI calculations. If an array set is activated, only those arrays will be used. In addition, if NO array sets are activated, all arrays will be used.
Bootstrapping
Bootstrap analysis can be used to generate a more reliable estimate of statistical significance for the interactions. Please see Margolin et al. 2006, Nature Protocols, Vol 1, No. 2, pg. 663-672 for further details (full reference below). Briefly, repeated runs of ARACNE are made, with arrays drawn at random from the full dataset with replacement. The same number of arrays is drawn each time as is present in the original dataset. A permutation test is then used to obtain a null distribution, against which the statistical significance of support for each network edge connection (interaction) can be measured.
- Bootstrap number: Specifies the number of bootstrapping runs to perform.
- Consensus threshold (for bootstrapping only): After the bootstrapping runs are made, a permutation test is used to estimate the significance of interactions. The consensus threshold sets the cutoff point for calling the interactions significant and returning them in the final adjancency matrix
<a name="_View_Arance_Results"></a>View Arance
ARACNE produces as output an adjacency matrix. This contains the MI score for each pair of expression profiles compared. The Cytoscape component can be used to visualize and further manipulate the inferred connectivity data, included selecting sets of interesting genes and returning them to the Markers component as a new set. A description of Cystoscape is located in the Cytoscape Tutorial and Help.
<img border="0" width="855" height="551" src="aracne_files/image002.png">
Selecting markers back into the Markers component in Cytoscape:
Using the mouse, left click and draw a box around markers of interest in the Cytoscape display. The enclosed markers will be highlighted in yellow.
<img src="aracne_files/T_ARACNE_Cytoscape_selecting_nodes.png" width="362" height="332">
The highlighted markers will also be returned to the Markers component as follows:
1. By default, the highlighted markers are returned to the default "Selection" set.
2. Alternatively, any existing set can be "tagged" by right-clicking on it and selecting "Tag for visualization". Any markers highlighted in Cytoscape will now be returned to the "tagged" set.
References
Margolin, A., Wang, K., Lim, W.K., Kustagi, M., Nemenman, I., and Califano, A. Reverse Engineering Cellular Networks. Nature Protocols (2006), Vol 1, No. 2, pgs. 663-672
