Difference between revisions of "Analysis Framework"
(→Layout of analysis components (as of geWorkbench 2.3.0)) |
(→Layout of analysis components (as of geWorkbench 2.3.0)) |
||
| Line 13: | Line 13: | ||
Either method will bring up a list of the currently loaded analysis components. Additional components may be available in the [[Component_Configuration_Manager||Component Configuration Manager]]. | Either method will bring up a list of the currently loaded analysis components. Additional components may be available in the [[Component_Configuration_Manager||Component Configuration Manager]]. | ||
| − | Selecting a component will cause its analysis control dialog to appear. All components share a common framework, but each also has its own controls and parameters. | + | |
| + | [[Image:Project_Folders_Analysis_ANOVA.png]] | ||
| + | |||
| + | |||
| + | Selecting a component will cause its analysis control dialog to appear. All components share a common framework, but each also has its own controls and parameters. The below figure shows the ANOVA analysis dialog. | ||
| + | |||
| + | |||
| + | [[Image:ANOVA_Parameters_w.png]] | ||
==Layout of the analysis framework (prior to geWorkbench 2.3.0)== | ==Layout of the analysis framework (prior to geWorkbench 2.3.0)== | ||
Revision as of 18:05, 29 February 2012
|
Home | Quick Start | Basics | Menu Bar | Preferences | Component Configuration Manager | Workspace | Information Panel | Local Data Files | File Formats | caArray | Array Sets | Marker Sets | Microarray Dataset Viewers | Filtering | Normalization | Tutorial Data | geWorkbench-web Tutorials |
Analysis Framework | ANOVA | ARACNe | BLAST | Cellular Networks KnowledgeBase | CeRNA/Hermes Query | Classification (KNN, WV) | Color Mosaic | Consensus Clustering | Cytoscape | Cupid | DeMAND | Expression Value Distribution | Fold-Change | Gene Ontology Term Analysis | Gene Ontology Viewer | GenomeSpace | genSpace | Grid Services | GSEA | Hierarchical Clustering | IDEA | Jmol | K-Means Clustering | LINCS Query | Marker Annotations | MarkUs | Master Regulator Analysis | (MRA-FET Method) | (MRA-MARINa Method) | MatrixREDUCE | MINDy | Pattern Discovery | PCA | Promoter Analysis | Pudge | SAM | Sequence Retriever | SkyBase | SkyLine | SOM | SVM | T-Test | Viper Analysis | Volcano Plot |
Contents
Overview
Most analysis routines are located in the command area in the lower right quadrant of geWorkbench. There they share a common framework and a common method for saving parameter settings.
Layout of analysis components (as of geWorkbench 2.3.0)
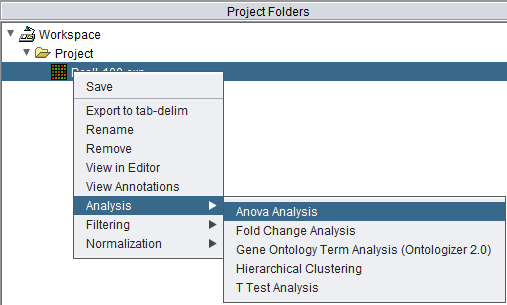
Analysis actions are activated in one of two ways.
- Right-click on a data node
- In the top Menu Bar, select Commands->Analysis
Either method will bring up a list of the currently loaded analysis components. Additional components may be available in the |Component Configuration Manager.
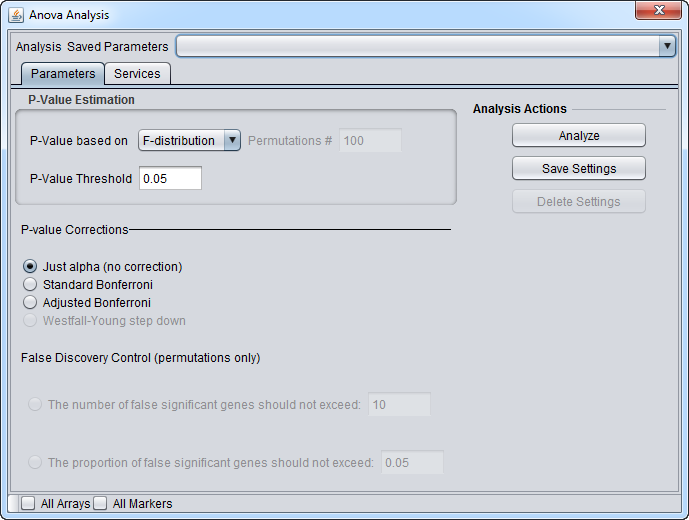
Selecting a component will cause its analysis control dialog to appear. All components share a common framework, but each also has its own controls and parameters. The below figure shows the ANOVA analysis dialog.
Layout of the analysis framework (prior to geWorkbench 2.3.0)
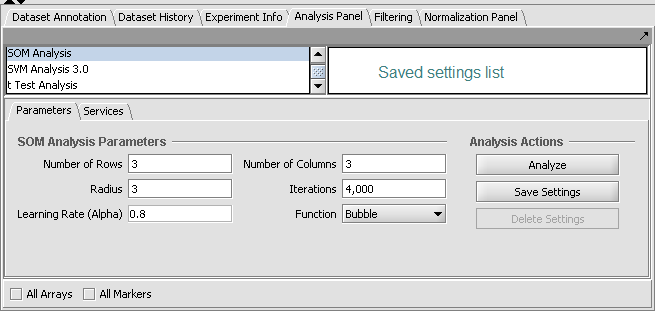
At upper left of the framework is a list of available analysis routines (as loaded using the Component Configuration Manager). At upper right is a list (labeled "Saved settings list") which can store named sets of customized parameter settings for each different analysis.
Analysis Actions
At right are three buttons shared by all analysis components:
Analyze
Launches the currently selected analysis with the specified parameters.
Save Settings
Save the current parameter settings to a named set in the settings list.
Delete Settings
Delete the currently highlighted settings entry from the list.
Analysis Parameters
The parameters and settings for the currently selected analysis component are located in the lower-left portion of the framework.
Creating saved parameter sets
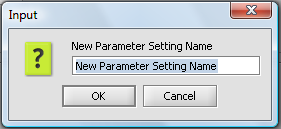
The current parameter settings can be saved by pushing the Save Settings button. A dialog will appear asking for a name for the new set of saved parameters.
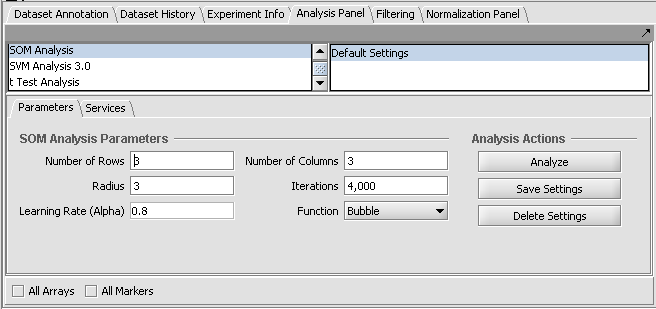
In this figure, the default settings have been saved to a set called "Default Settings".
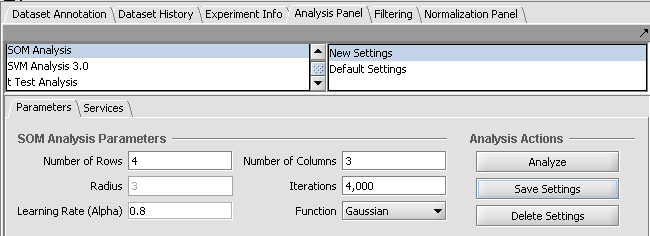
The next figure illustrates changing a couple of parameters and saving them to a new set called "New Settings".
Interplay of parameters and list
The analysis parameters can be restored to their saved values by selecting the desired item on the list.
For most analysis components, when the parameters shown in the graphical interface are made to exactly match those stored in a list entry, that entry will be selected (highlighted). If any change is made so that the parameters no longer match a stored entry, then no entry will be highlighted.
