Difference between revisions of "Array Sets"
(→Classifying a set) |
|||
| Line 1: | Line 1: | ||
{{TutorialsTopNav}} | {{TutorialsTopNav}} | ||
| − | == | + | ==Background== |
| − | + | geWorkbench makes extensive use of the notion of sets of markers or arrays/phenotypes. Sets of markers are returned from various analysis routines. Sets of arrays/phenotypes can be specified to group arrays in a meaningful fashion for statistical analysis. For example, two such phenotypes might be the diseased and normal states of a tissue from which samples have been taken. | |
| + | geWorkbench supports groupings of sets. Each such group can contain different sets of markers or arrays, or alternatively just assign different names to the same arrangements of underlying data, for example abbreviations vs descriptive names. | ||
| − | |||
| − | + | ==Preparation== | |
| − | + | In this tutorial we will start with the same data files that were used in [[Tutorial - Projects and Data Files]]. Load the ten individual MAS5 data files as shown there. | |
==Assigning arrays to sets== | ==Assigning arrays to sets== | ||
| − | + | We will place the arrays in the default group, however you can create new a new group by pushing the '''New''' button on '''Array/Phenotype Sets''' at lower left. | |
First, we will select and label arrays which contain samples from the congestive cardiomyopathy disease state: | First, we will select and label arrays which contain samples from the congestive cardiomyopathy disease state: | ||
Revision as of 22:40, 27 February 2006
Contents
Background
geWorkbench makes extensive use of the notion of sets of markers or arrays/phenotypes. Sets of markers are returned from various analysis routines. Sets of arrays/phenotypes can be specified to group arrays in a meaningful fashion for statistical analysis. For example, two such phenotypes might be the diseased and normal states of a tissue from which samples have been taken.
geWorkbench supports groupings of sets. Each such group can contain different sets of markers or arrays, or alternatively just assign different names to the same arrangements of underlying data, for example abbreviations vs descriptive names.
Preparation
In this tutorial we will start with the same data files that were used in Tutorial - Projects and Data Files. Load the ten individual MAS5 data files as shown there.
Assigning arrays to sets
We will place the arrays in the default group, however you can create new a new group by pushing the New button on Array/Phenotype Sets at lower left.
First, we will select and label arrays which contain samples from the congestive cardiomyopathy disease state:
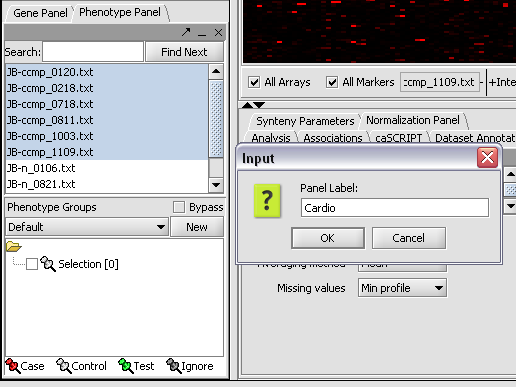
1. In the Arrays/Phenotypes component, select the following arrays from samples from the congestive cardiomyopathy disease state:
JB-ccmp_0120.txt, JB-ccmp_0218.txt, JB-ccmp0718.txt, JB-ccmp0811.txt, JB-ccmp1003.txt, JB-ccmp_1109.tx
2. Right-click, select Add to Set.
3. Enter "Cardio" in the input box and click OK.
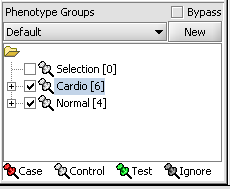
4. Next, similarly label the follow arrays as "Normal" ( repeat steps 2 & 3 ):
JB-n_0106.txt , JB-n_0821.txt, JB-n_0915.txt, JB-n_1303.txt
Activating sets
5. Select the checked boxes next to the panel name to indicate that these sets of arrays are "Active". Various analysis and visualization components can be set to only use/display activated arrays or markers.
Classifying a set
For statistical tests such as the t-test, Case and Control groups can be specified.
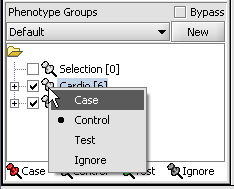
- Left-click on the thumb-tack icon in front of the phenotype name.
- Select Case to specify the disease arrays as the "Case". The remaining "Normal" arrays are by default labeled control.
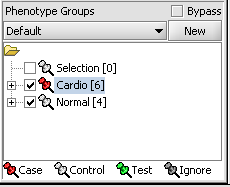
A red thumbtack indicates the arrays have been specified as "Case".


