Basics
Basic Layout of the Graphical User Interface
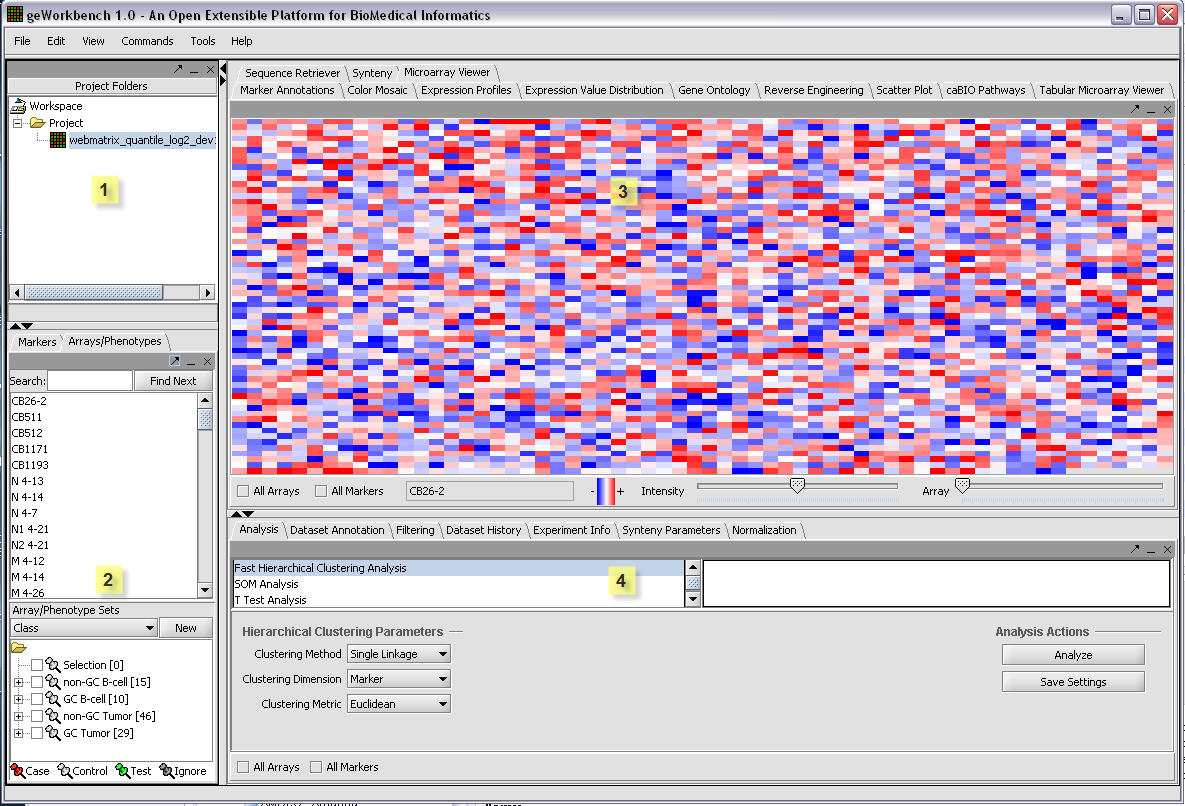
The graphical user interface for geWorkbench is divided into four major sections, for
1. Projects - Data management (upper left)
2. Marker and Array/Phenotype set selection and management (lower left)
3. Visualization tools (upper right)
4. Analytical tools (lower right)
The Data Management area can hold one workspace, and a workspace in turn can hold one or more projects. Projects can be used as wished to group different data sets. Each opened data file or analysis result is stored in a project. A workspace and all the data it contains can be saved and returned to later.
The GUI provides a menu bar at top with a standard choice of commands. Many commands that are available in the menu bar are also available by right-clicking on data objects.
Component Interoperability
The most important design goal of geWorkbench is to allow data produced or altered in one module to be easily transfered to other modules for successive analysis steps. There are two places that hold shared data - the Project component (1), and the Set Selection component(2). While the Project component holds files and various types of analysis result sets, the Set Selection component groups markers or arrays/phenotypes into sets. These sets can then be selected for further analysis of only that particular subset of data. For example, several analysis components produce lists of markers, and each such new list is placed into the Markers component as a new marker set. An example of using a phenotype set is to group microarrays by their disease state.
A key feature of the GUI is that the modules displayed in the Visualization (3) and Analysis (4) areas depend on the type of data currently selected in the Project area (1). Thus you will see a different set of choices (tabs) when a microarray data set is selected, as compared to when a DNA or protein sequence file is selected. When a new data file is loaded, or an analysis produces a new data set, not only is it added to the Project area, but an appropriate viewer in the Visualization area is automatically selected.

