Cytoscape Network Viewer
Contents
Overview
Cytoscape (www.cytoscape.org) is a sophisticated network and pathway visualization tool that has been incorporated into geWorkbench as a component. Within geWorkbench, Cytoscape is used to depict putative interaction networks, for example as created from running ARACNe or a Cellular Network Knowledge Base query. Both of these tools return "adjacency matrices", that is, interaction networks, to the Project Folders component.
Cytoscape has been integrated into geWorkbench in such a way that it can communicate in both directions with the Markers component.
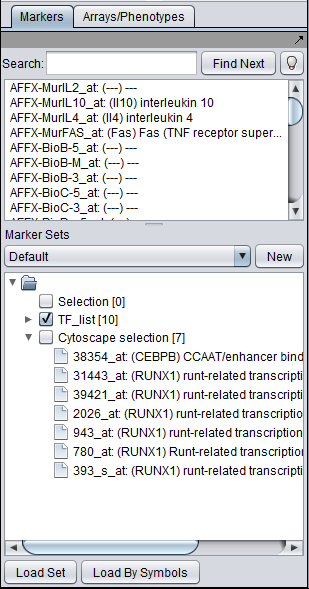
- Nodes in a Cytoscape network can be selected individually or by drawing a selection box around them. This will result in the selected nodes being placed into the "Cytoscape selection" set in the Markers component.
- A set of markers in the Markers component can be labeled with the "tag for visualization" property, which will project that set onto the network depicted in Cytoscape. Those markers in the intersection of the tagged set and the network display will be highlighted in yellow.
The use of Cytoscape, and its interactions with geWorkbench, are described in the following sections. The figures shown in this chapter were generated using the query results obtained in the Cellular_Networks_KnowledgeBase chapter.
First we will describe the layout of the Cytoscape graphical interface.
Layout of the Cytoscape component
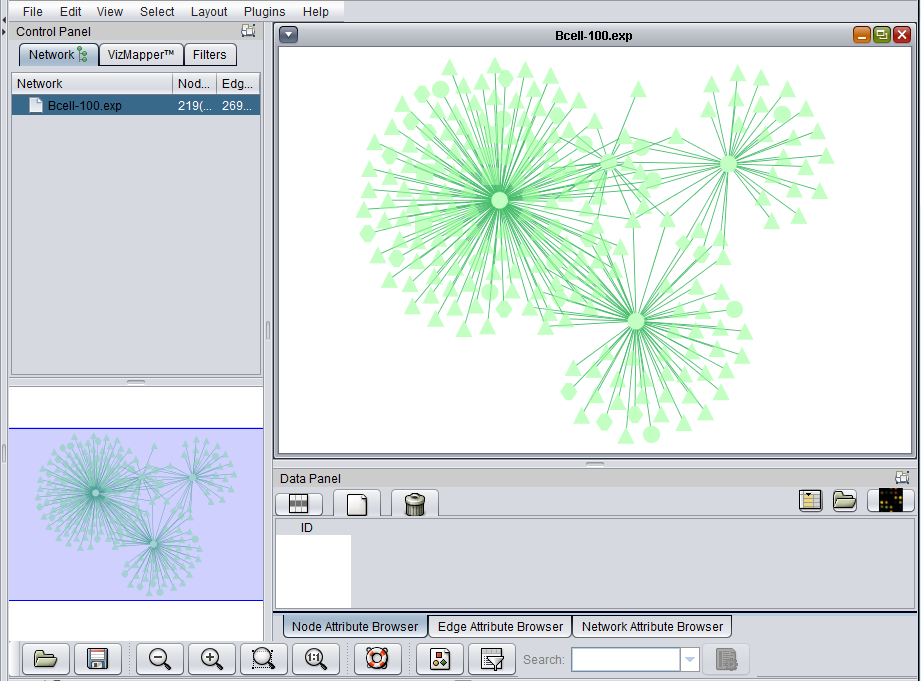
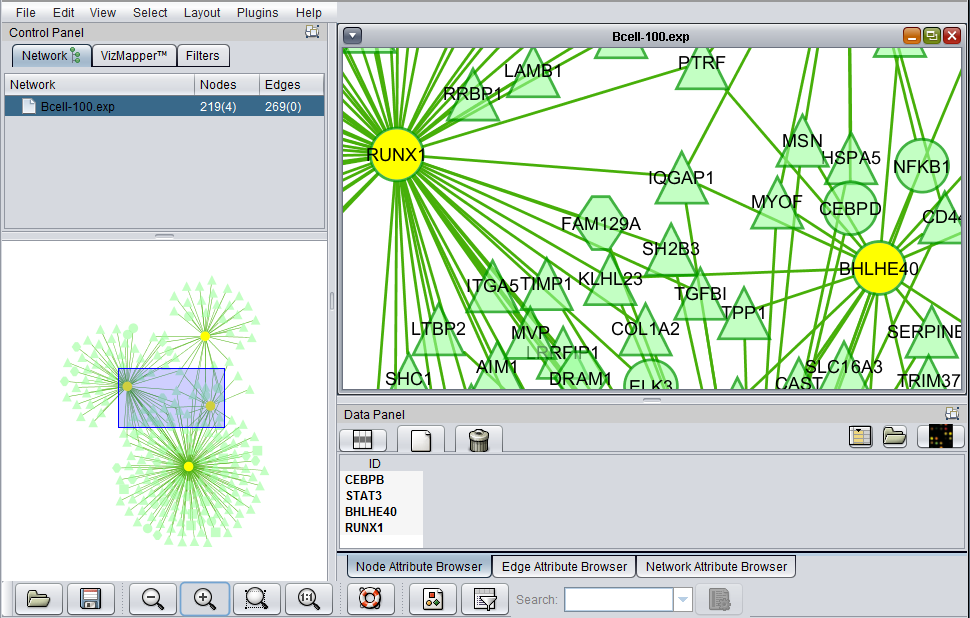
The Cytoscape component has 4 main areas:
- At upper left is a list of networks that have been loaded into Cytoscape, showing the network name and the number of nodes and edges. In addition, the numbers in parentheses show the numbers of nodes and edges which have been highlighted (selected) in the network depiction.
- At upper right is the main network depiction pane. Gene or protein symbols/names will be depicted if available. However, if for example an Affymetrix microarray dataset was read in but no annotation file was associated with it, then only probeset names will appear. Selected nodes are depicted in yellow and are returned to the "Cytoscape selection" set in the Markers component. Selected edges are depicted in red.
- At lower left is a navigation tool which shows the entire network and the location and size (purple rectangle) of the current viewing pane. The purple viewing pane can be moved about the network as desired. This is done by left-clicking with the mouse in the purple rectangle and moving it.
- At lower right, nodes or edges that have been selected in the network display will appear in the Data Panel.
Integration of Cytoscape and geWorkbench
This section depicts the network generated in the Cellular_Networks_KnowledgeBase chapter.
Selecting interactions (edges)
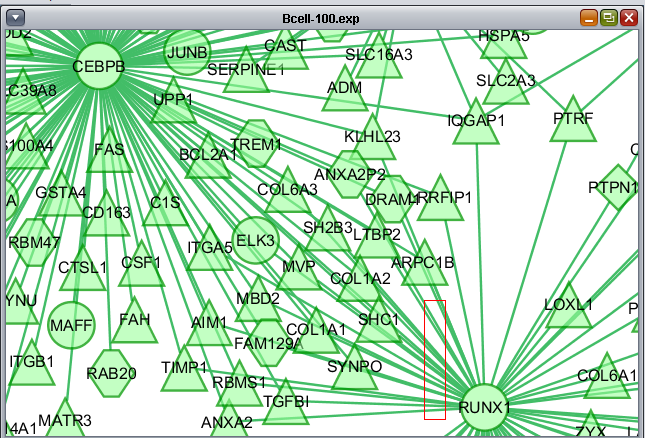
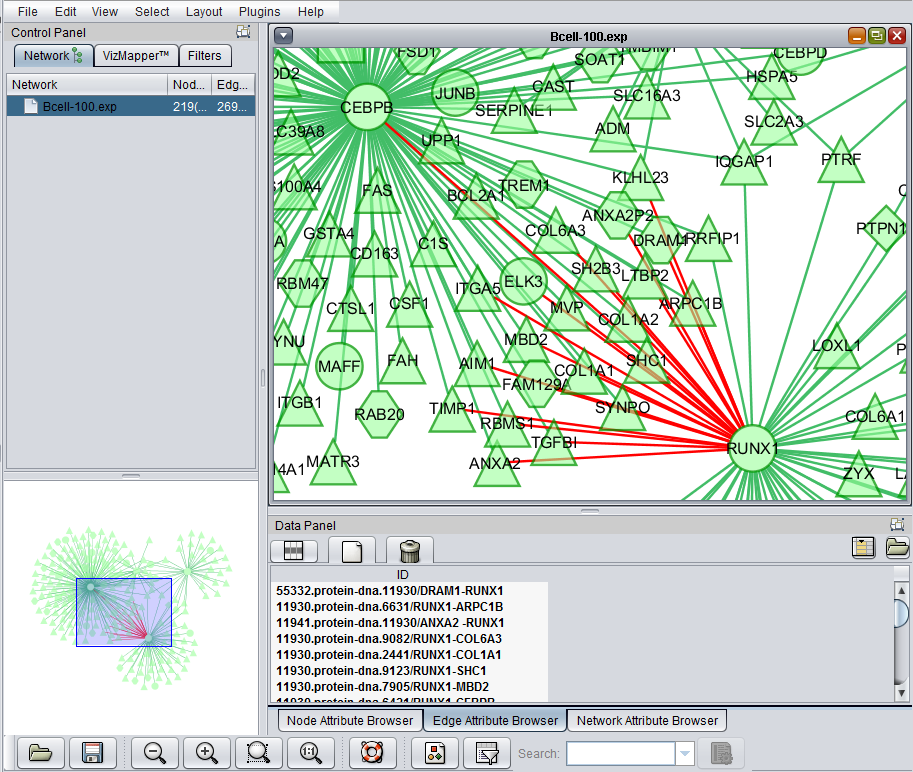
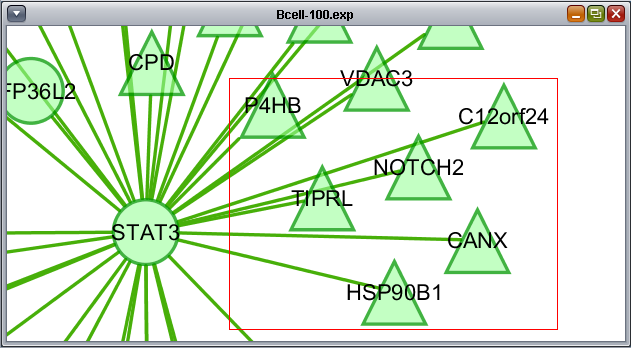
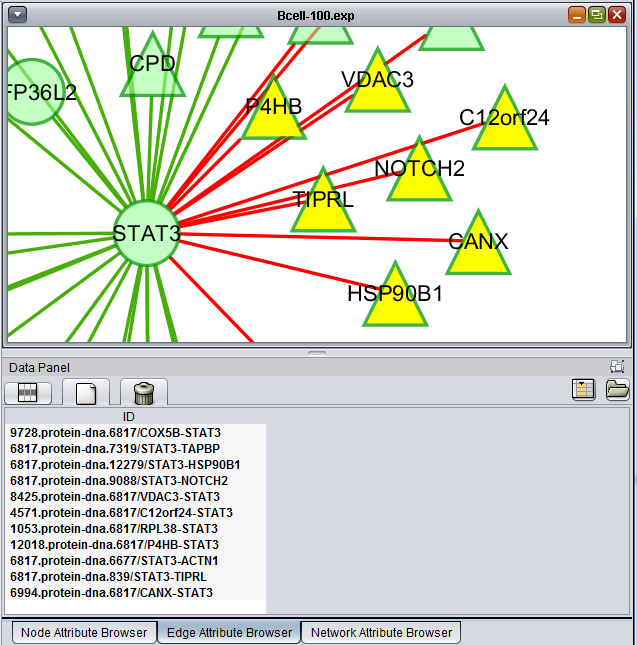
Using the mouse, a group of edges can be selected. Hold down the mouse button while drawing a box on the screen around the desired edges. The box will appear in red.
The list of selected edges is displayed in a list below the graph, in a tab titled "Edge Attribute Browser".
Selecting nodes
- Individual nodes and/or edges can be selected in Cytoscape by clicking on them with the mouse.
- To select multiple nodes or edges, hold down the Shift key while making the selection.
- Alternatively, a selection box can be drawn around both nodes and edges by left-clicking in the network diagram and selecting the desired targets.
The markers corresponding to the selected genes will be displayed directly in the Markers component in a new subset called "Cytoscape selection". Note that this set is dynamically updated - it displays markers corresponding to whatever nodes are currently highlighted in the network graph.
If a gene in the Cytoscape display is represented by more than one probeset, all of its probesets will appear in the Markers component.
To make a permanent copy of a particular set of dynamically chosen markers in the "Cytoscape Selection" subset, right-click on it and select "Copy".
Selecting both nodes and edges
A selection box, described above for selecting edges, can also be drawn to include both nodes and edges at the same time.
The selected nodes and edges will be listed in the Node Attribute Browser and Edge Attribute Browser lists below the network diagram.
Options for selected nodes
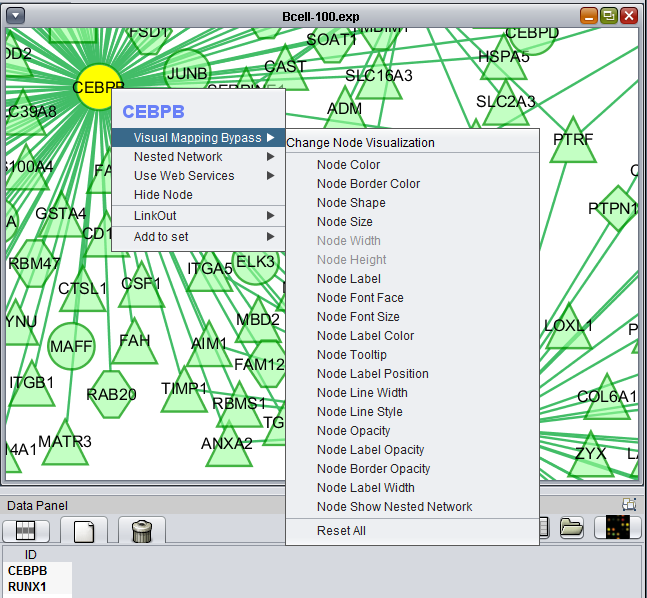
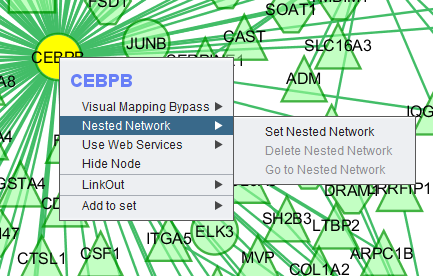
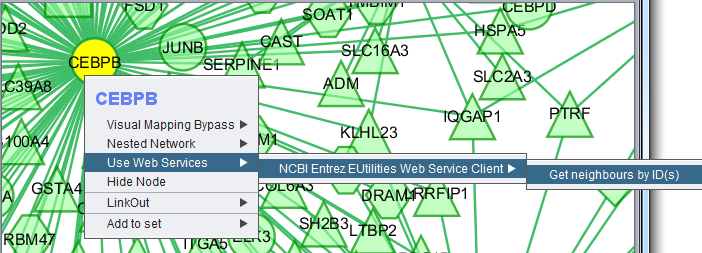
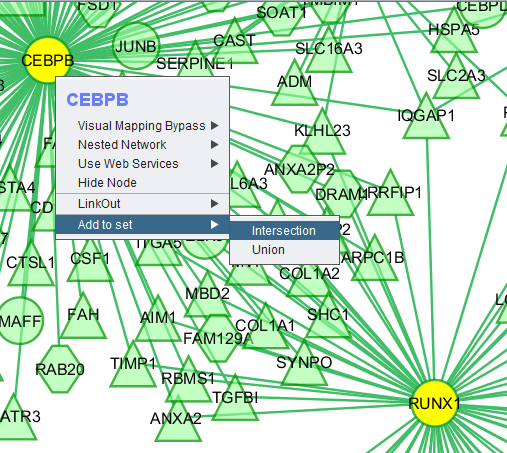
Right-clicking on a particular node in the network graph brings up a menu with three options:
- Visual Mapping Bypass
- LinkOut
- Add to set
Visual Mapping Bypass
Nested Network
Use Web Services
Hide Node
Selecting "Hide Node" will cause any selected nodes and all their edges to disappear.
So far, the only way we have found to rematerialize a hidden node is to go the Cytoscape Network tab, select the network, destroy its view and then create a new view.
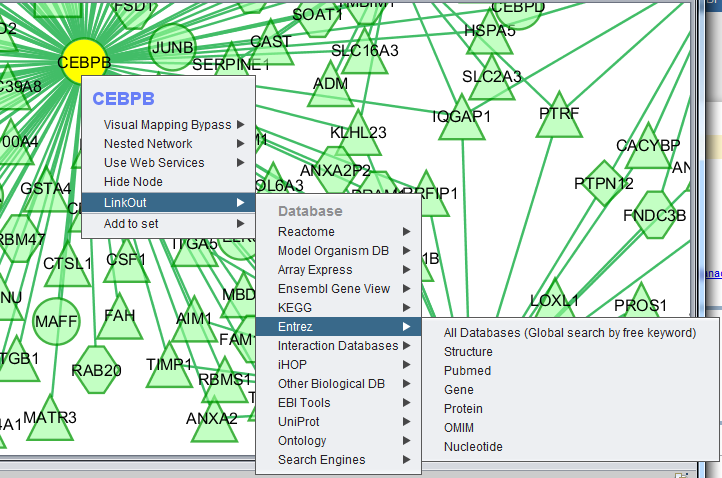
LinkOut
This menu option provides hyperlinks to a number of external sources of gene annotation.
Add to set
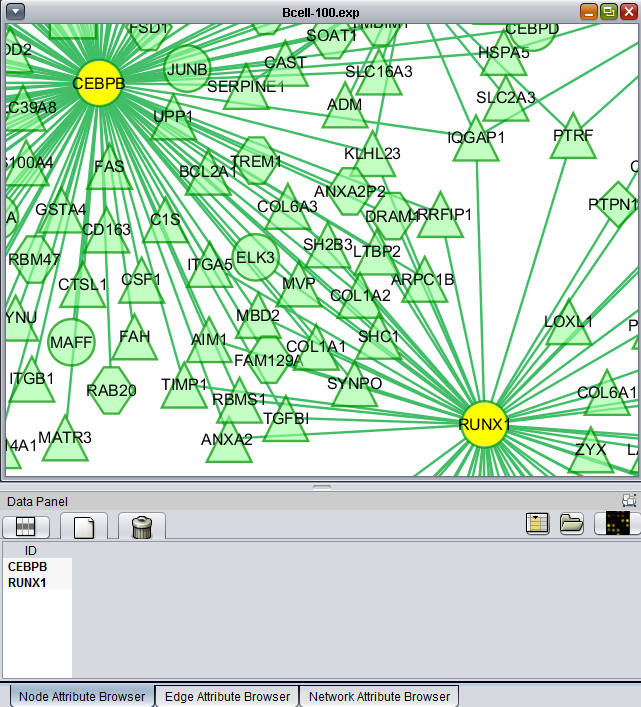
If one or more graph nodes have been selected (highlighted in yellow in figure below), the markers they directly interact with (via edges) can be copied to the default "Cytoscape selection" subset in the Markers component at lower left in the geWorkbench graphical interface.
Two options are available under "Add to Set". These are
- Intersection - find the set of markers that have interactions (edges) with ALL selected nodes. Such markers are placed into the Markers component, in the "Cytoscape selection" subset.
- Union - find the set of markers that have interactions (edges) with ANY of the selected nodes. Such markers are placed into the Markers component, in the "Cytoscape selection" subset.
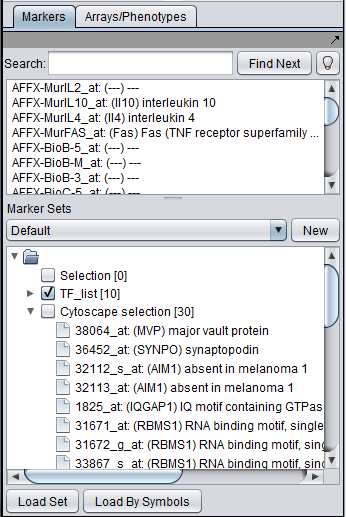
This image shows the intersection set of markers for the two selected genes:
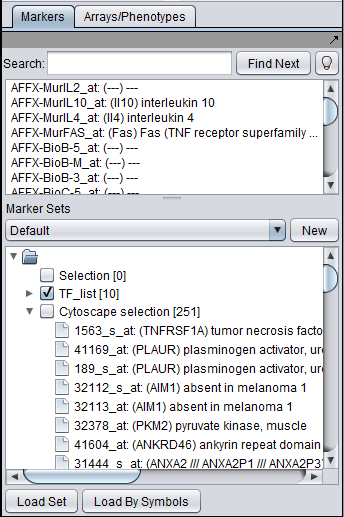
This image shows the union set of markers for the two selected genes.
Note - For each gene included in the UNION or INTERSECTION, there may be more than one marker associated with it. If so, all markers belonging to a particular gene in a UNION or INTERSECTION result will be returned to to the Markers component "Cytoscape Selection" set.
Projecting marker sets onto Cytoscape
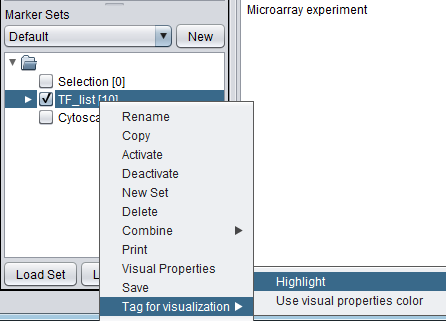
The diagram below illustrates projecting a set defined in the Markers component back onto the Cytoscape network diagram. In this case, the set of transcription factors originally used in to form the CNKB query which generated this example is labeled with "tag for visualization" by right-clicking on it and selecting this menu option.
Each gene or marker that is present at least once in the tagged set, and which is also present in the drawn network, is highlighted in yellow in the network display.
Altering the view in Cytoscape
The use of the sliding viewpane at lower left to navigate about the main drawn network has already been mentioned - it can be grabbed and moved by left-clicking on it with the mouse.
There are several more controls arrayed about the lower edge of the Cytoscape component. These include four magnifying glass icons:
- "minus" - zoom out.
- "plus" - zoom in.
- "open" - zoom to display selected region.
- "1:1" - zoom out to display all of current network.
In the image below, the view has been zoomed in:
Network commands
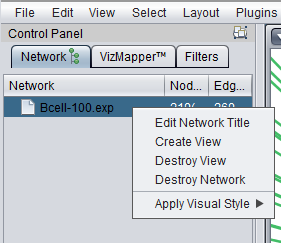
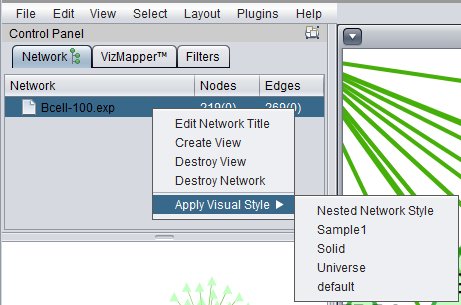
Right-clicking on a listed network in Cytoscape will bring up a menu with the following choices:
Edit Network Title
Edit the title of the network.
Create View
Recreate the network graphics.
Destroy View
Remove the network graphics.
Destroy Network
Completely remove the network from Cytoscape. Note that this does not remove the netowrk adjacency matrix from the geWorkbench Project Folders component. The network can be recreated in Cytoscape by clicking on the appropriate adjacency matrix in the Project Folders component.
