Difference between revisions of "Filtering"
(→Deviation Filter) |
(→Available Filters) |
||
| Line 23: | Line 23: | ||
|'''Missing values''' ||Removes markers that have “missing” measurements in more than a specified number (or percentage) of microarrays. | |'''Missing values''' ||Removes markers that have “missing” measurements in more than a specified number (or percentage) of microarrays. | ||
|- | |- | ||
| − | |'''Deviation''' ||Removes markers whose '''standard deviation''' is less than a specified value across all microarrays. | + | |'''Deviation''' ||Removes markers whose '''sample standard deviation''' is less than a specified value across all microarrays. |
|- | |- | ||
|'''Expression Threshold''' ||Removes markers where more than a specified number (or percentage) have values inside (or outside) a user-defined range. | |'''Expression Threshold''' ||Removes markers where more than a specified number (or percentage) have values inside (or outside) a user-defined range. | ||
Revision as of 14:46, 7 June 2010
Contents
Overview
Filtering can be used to remove low quality data or reduce the size of the dataset by removing less interesting data. Most geWorkbench filters allow the user to specify a minimum number or percentage of arrays that must meet that filter's critereon before the marker will be removed.
Filter Configuration
Some filters are not loaded by default in geWorkbench. To configure which filters to load, use the Component Configuration Manager. It is available in the top menu-bar under Tools->Component Configuration.
Available Filters
| Filter | Description |
|---|---|
| Affy Detection Call | Applicable to Affymetrix data only. Filter on Present, Marginal or Absent calls. |
| Missing values | Removes markers that have “missing” measurements in more than a specified number (or percentage) of microarrays. |
| Deviation | Removes markers whose sample standard deviation is less than a specified value across all microarrays. |
| Expression Threshold | Removes markers where more than a specified number (or percentage) have values inside (or outside) a user-defined range. |
| Genepix Expression Threshold | Applicable to 2-channel arrays (Genepix) data only. Defines applicable ranges for each channel, and removes markers for which, for more than a specified number (or percentage) of markers, either channel intensity is inside (or outside) the defined range. |
| GenePix Flags | Remove markers where more than a specified number (or percentage) of values match the selected flag (flagged in GenePix software). |
Basic Controls
Overview
- Filter (menu) - select the desired filter.
- Save Parameters (menu) - allows selection of stored parameter settings.
- Filter (button)- run the selected filter.
- Preview - preview the filtering action (see following section).
- Save Settings - Save the current settings (see following section).
- Delete Settings- delete the currently selected parameter set.
Filtering Preview
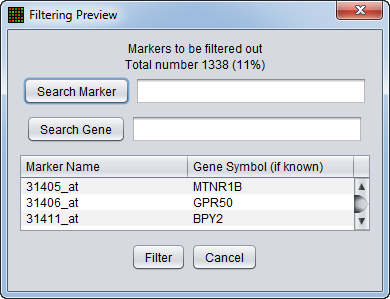
The filtering action can be previewed to allow the user to judge whether to proceed with the current parameter settings. The markers that will be removed are listed, as is a count of the markers in the list. The list displays marker names and, where available, gene names. Either list can be searched on.
- Search Marker - Search the list by marker name.
- Search Gene - Search the list by gene name.
- Filter - perform the filtering action.
- Cancel - Cancel the filtering action, no change is made.
Saving Parameters
The current parameter settings can be saved to a named parameter set. The saved set will be displayed in the pull-down menu at upper right in the component. Any number of parameter sets can be saved. If the currently set parameters match a saved set, that set's entry will be shown in the menu.
- Save Settings - save the current settings to a new parameter set.
- Delete Settings - delete the currently selected parameter set from the menu.
Specific Controls for each Filter
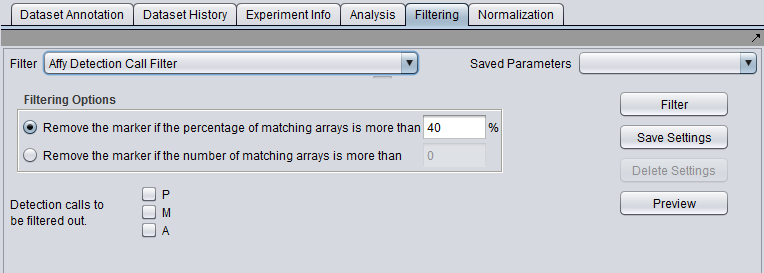
Affymetrix Detection Call Filter
Certain Affymetrix data analysis software, e.g. MAS5/GCOS, produces a confidence value for the expression measurement of each probeset (marker) on each array. These confidence values (actually p-values) are used to categorize each reading as either Present, Marginal or Absent, based on fixed cutoff values.
The Detection Call Filter allows the user to remove markers which in more than a certain number, or a certain percentage, of arrays have a particular call.
That is, the user might specify that if the value for a particular marker is called "Absent" on more than 40% of the arrays, the marker should be filtered out.
Detection calls to be filtered out
- P - Present
- M - Marginal
- A - Absent
Any combination of boxes may be checked, and the number of arrays on which any of the checked conditions are met for a given marker will be summed.
Filtering Options
- Remove the marker if the percentage of matching arrays is more than N. - If for a given marker, the sum of detection calls matching those chosen by the user exceeds the given percentage, the marker will be removed.
- Remove the marker if the number of matching arrays is more than N. - If for a given marker, the sum of detection calls matching those chosen by the user exceeds the given percentage, the marker will be removed.
Deviation Filter
This filter measures, for each marker, the sample standard deviation of the expression values across all arrays. If the sample standard deviation is less than the given "bound", then the marker will be filtered out.
- Std. Deviation bound - markers showing a sample standard deviation below this bound will be filtered out.
- Missing values - Before computing the standard deviation, this filter can replace any missing values in the data. The available methods are
- Marker Average - Replace any missing values for a particular marker with the average of its available values across all arrays.
- Microarray Average - Replace any missing values for a particular array with the average of its available values across all markers.
- Ignore - Do not replace any missing values.
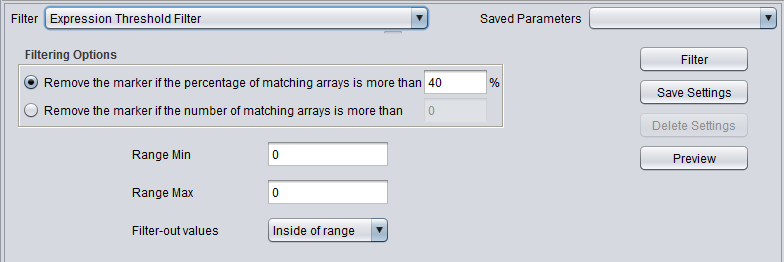
Expression Threshold Filter
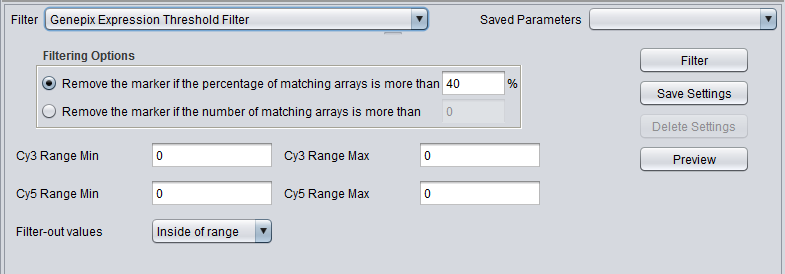
GenePix Expression Threshold
GenePix Flag Filter


