Difference between revisions of "Fold Change"
(→Calculation Method) |
(→Calculation Method) |
||
| Line 22: | Line 22: | ||
===Calculation Method=== | ===Calculation Method=== | ||
| − | * Ratio - calculated with linear values, for each marker, as Avg(Case arrays)/Avg(Control arrays). Log2 data will be first transformed back to linear. Ratios less than 1 are inverted and given a negative sign, e.g. 0.25 is reported as -4. | + | * '''Ratio''' - calculated with linear values, for each marker, as Avg(Case arrays)/Avg(Control arrays). Log2 data will be first transformed back to linear. Ratios less than 1 are inverted and given a negative sign, e.g. 0.25 is reported as -4. |
| − | * Difference of average log2 values - calculated with log2 values, for each marker, Avg(log2(Case arrays)) - Avg(log2(Control arrays)). Linear data will be transformed to log2. Here, if the Case arrays have lower expression than the Control, the negative sign results directly. | + | * '''Difference of average log2 values''' - calculated with log2 values, for each marker, Avg(log2(Case arrays)) - Avg(log2(Control arrays)). Linear data will be transformed to log2. Here, if the Case arrays have lower expression than the Control, the negative sign results directly. |
Revision as of 16:30, 1 June 2011
Overview
(The Fold Change component was inadvertently omitted from geWorkbench release 2.2.0. It is available in the development version).
Fold change is used to compare the expression of genes between two sets of arrays, e.g. case and control sets.
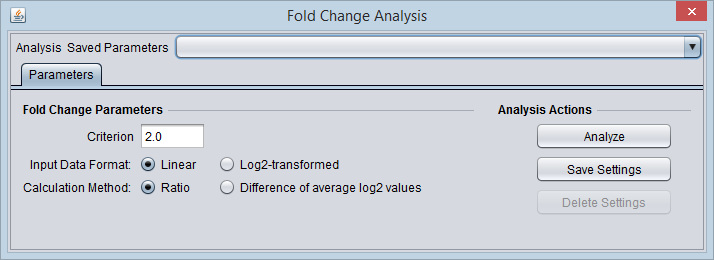
This component allows a threshold for fold-change to be set. Markers that exceed the threshold are placed into new sets in the Markers component - one for those with positive fold-change, the other for negative (where the inverse is above threshold).
Two methods are provided to calculate fold change. The component also allows either calculation to be carried out starting with either linear or log2-transformed data.
Options
Input Data Format
To correctly calculate the chosen fold-change value, the component must know if the data is linear or log2 transformed. This must be specified by the user.
- Linear
- Log2-transformed
Calculation Method
- Ratio - calculated with linear values, for each marker, as Avg(Case arrays)/Avg(Control arrays). Log2 data will be first transformed back to linear. Ratios less than 1 are inverted and given a negative sign, e.g. 0.25 is reported as -4.
- Difference of average log2 values - calculated with log2 values, for each marker, Avg(log2(Case arrays)) - Avg(log2(Control arrays)). Linear data will be transformed to log2. Here, if the Case arrays have lower expression than the Control, the negative sign results directly.

