Difference between revisions of "Hierarchical Clustering"
(→Displaying results in the Dendrogram component) |
|||
| Line 66: | Line 66: | ||
===Displaying results in the Dendrogram component=== | ===Displaying results in the Dendrogram component=== | ||
| + | |||
| + | Hierarchical clustering results are displayed in the Dendrogram component. The four horizontal bars shown in the diagram below were added just to show the boundaries of the four activated array sets. | ||
| + | |||
| + | [[Image:T_HC_Dendrogram_marked.png]] | ||
| + | |||
| + | |||
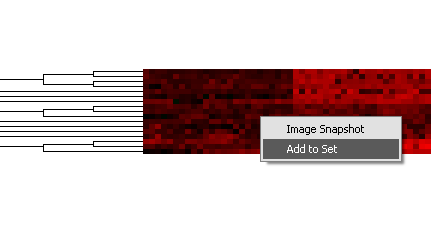
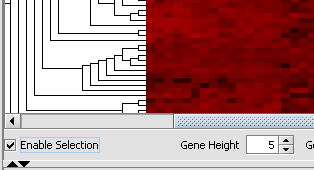
| + | The Dendrogram component allows one to select and work with just a portion of the displayed tree. To activate this feature, check the | ||
| + | |||
| + | [[Image:T_HC_Dendrogram_selecting.png]] | ||
| + | |||
| + | [[Image:T_HC_Dendrogram_selection.png]] | ||
| + | |||
| + | |||
| + | |||
| + | |||
| Line 73: | Line 88: | ||
[[Image:T_HC_Dendrogram_EnableSelection.png]] | [[Image:T_HC_Dendrogram_EnableSelection.png]] | ||
| − | |||
| − | |||
| − | |||
| − | |||
| − | |||
[[Image:T_HC_MarkerSets-ClusterTree.png]] | [[Image:T_HC_MarkerSets-ClusterTree.png]] | ||
Revision as of 19:01, 28 July 2009
|
Home | Quick Start | Basics | Menu Bar | Preferences | Component Configuration Manager | Workspace | Information Panel | Local Data Files | File Formats | caArray | Array Sets | Marker Sets | Microarray Dataset Viewers | Filtering | Normalization | Tutorial Data | geWorkbench-web Tutorials |
Analysis Framework | ANOVA | ARACNe | BLAST | Cellular Networks KnowledgeBase | CeRNA/Hermes Query | Classification (KNN, WV) | Color Mosaic | Consensus Clustering | Cytoscape | Cupid | DeMAND | Expression Value Distribution | Fold-Change | Gene Ontology Term Analysis | Gene Ontology Viewer | GenomeSpace | genSpace | Grid Services | GSEA | Hierarchical Clustering | IDEA | Jmol | K-Means Clustering | LINCS Query | Marker Annotations | MarkUs | Master Regulator Analysis | (MRA-FET Method) | (MRA-MARINa Method) | MatrixREDUCE | MINDy | Pattern Discovery | PCA | Promoter Analysis | Pudge | SAM | Sequence Retriever | SkyBase | SkyLine | SOM | SVM | T-Test | Viper Analysis | Volcano Plot |
Contents
Overview
geWorkbench implements its own code for agglomerative hierarchical clustering.
Note - hierarchical clustering is memory intensive. With the default memory settings (see here to change), clustering more than about 2000 markers is not recommended.
Parameters
Clustering Method
Single Linkage
Average Linkage
Total Linkage
Clustering Dimension
Marker
Microarray
Both
Clustering Metric
Euclidean
Pearson's
Spearman's
All Arrays
All Markers
Example
Running the calculation
This example will take off with the set of markers produced in the ANOVA example. Please follow the steps for that example to produce the starting marker set, or just create/select another set of markers of your own.
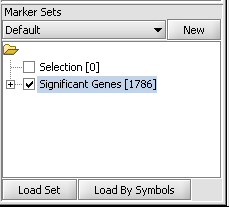
1. If following the ANOVA example, activate the set of markers labeled "Significant Genes [1786]" ( which contains 1786 markers).
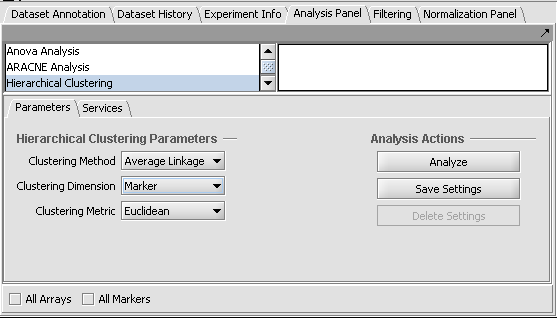
2. Set the parameters as shown in the following figure.
- Clustering methods: Average Linkage.
- Clustering Dimension: Marker.
- Clustering Metric: Euclidean.
3. Click Analyze.
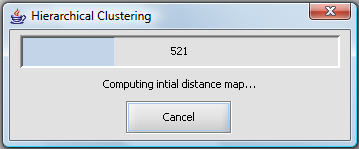
4. A progress bar will be visible during the calculation.
The results are placed in the Project Folders component and labeled "Hierarchical Clustering", and can be displayed in the Dendrogram component.
Displaying results in the Dendrogram component
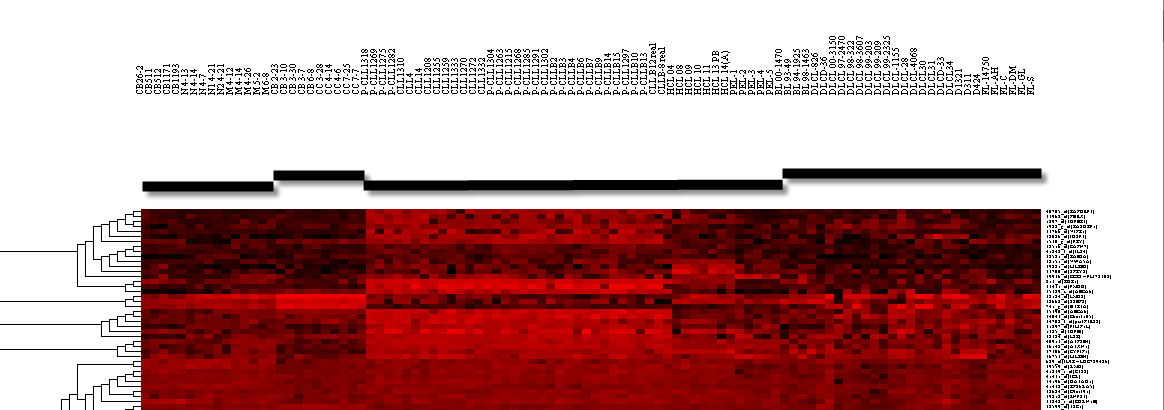
Hierarchical clustering results are displayed in the Dendrogram component. The four horizontal bars shown in the diagram below were added just to show the boundaries of the four activated array sets.
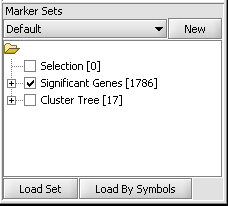
The Dendrogram component allows one to select and work with just a portion of the displayed tree. To activate this feature, check the
