Difference between revisions of "LINCS Query"
(→Heatmap (Color Mosaic Component)) |
(→Heatmap (Color Mosaic Component)) |
||
| Line 64: | Line 64: | ||
[[Image:LINCS_HeatMap.png]] | [[Image:LINCS_HeatMap.png]] | ||
| + | |||
| + | |||
| + | |||
| + | * '''Double-click for titration graphs''' - Double-clicking on a cell in the heatmap will bring up a selector which allows the user to choose between plotting the underlying titration curves or an isobologram for the selected drug pair (when available). The selector is shown here: | ||
| + | |||
| + | |||
| + | [[Image:LINCS_titration_select.png]] | ||
Revision as of 12:06, 27 June 2013
Contents
Overview
LINCS - Library of Integrated Network-based Cellular Signatures
This component provides for query and display of data generated by the Columbia LINCS Technology U01 and Computation U01 Centers. It provides experimental and computational results for drug mode of action and similarity calculations, and for synergy experiments.
LINCS Query and Display
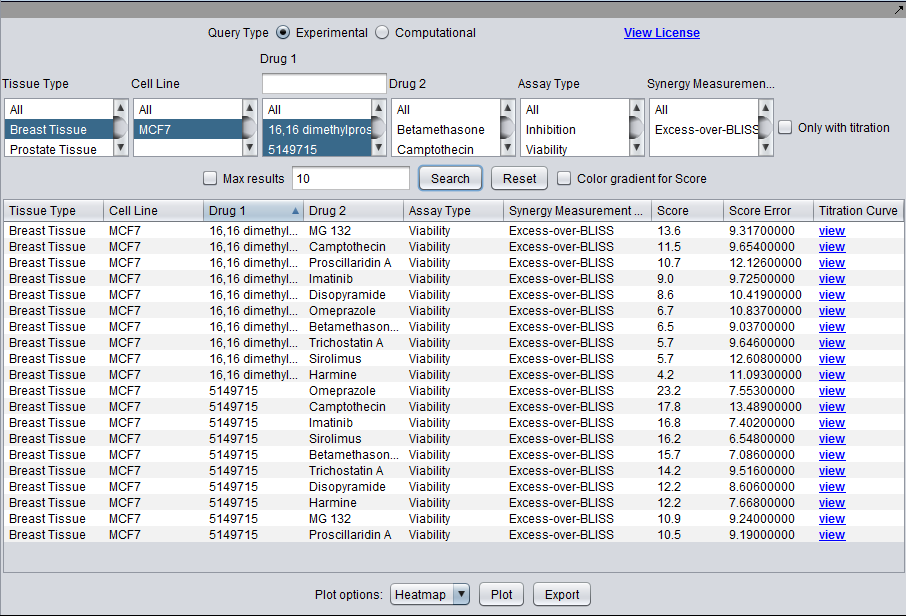
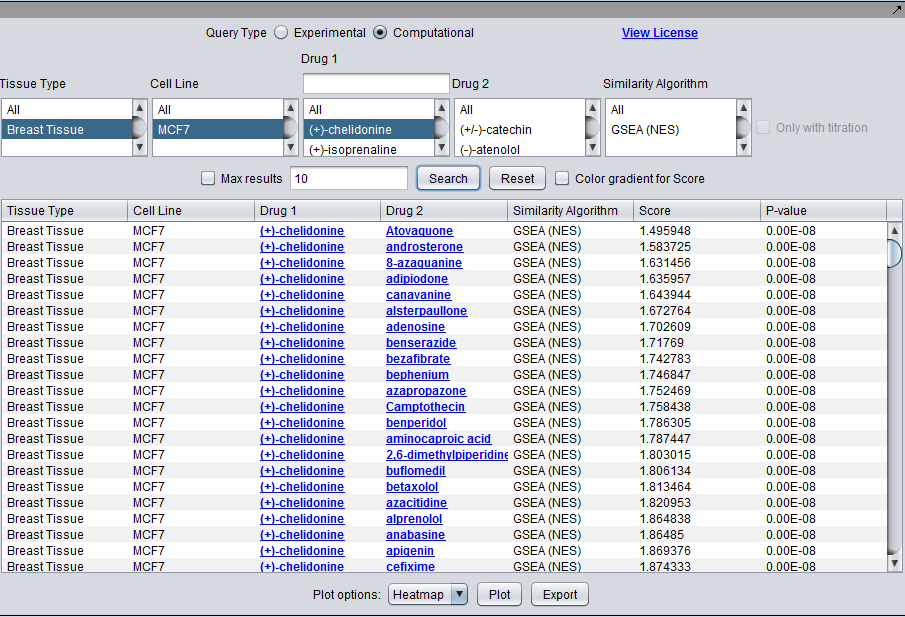
Query for experimental synergy results for tested drug pairs, or computational drug similarity results based on gene expression experiments. In the current experimental design, drug 1 and drug 2 are not symmetric; they are generally drawn from separate lists of compounds. This difference is preserved in the database.
Experimental and Computational: Search Controls in Common
- Tissue Type - The tissue from which the tested cell line was originally derived. More than one tissue can be chosen for a single query.
- Cell Line - The cell line tested in a particular experiment. More than one cell line can be chosen for a single query (multiple selection), subject to any constraint on "Tissue Type".
- Drug 1 - Entries stored as "drug 1" in a pair, subject to previous choices of tissue type or cell line, if any. One or more drugs (multiple selection) must be chosen. (For plotting a Heatmap, a multiple selection is counted as a free variable, as though no selection had been made).
- Drug 2 - Entries stored as "drug 2" in a pair, given current constraints on tissue type, cell line, and drug 1. More than one drug can be chosen for a single query (multiple selection). (For plotting a Heatmap, a multiple selection is counted as a free variable, as though no selection had been made).
- Dynamic Search on Drug 1 - currently the number of drugs in "Drug 1" can be considerably larger than in "Drug 2". For this reason, a dynamic search box is offered above the "Drug 1" selection. As each character is typed, the "Drug 1" list will be updated to only show matching drugs.
- The match is not case-sensitive.
- The match can occur anywhere in the drug name.
Experimental vs Computational: Mode-Specific Search Controls
Radio buttons are used to select whether to query for experimental or computational results. Only one type can be chosen at a time. These result types are held in separate tables in the database and the scores have different ranges.
The controls specific to each type are:
Experimental
- Assay Type (phenotypic readout): Viability, proliferation, apoptosis, cell morphology, oxidization state, etc.
- Synergy Measure (Excess over Bliss, Excess over highest single agent, Combination Index, etc.).
- Only with titrations (check box) - Restrict search results displayed in the lower spreadsheet to those for which titration curves are available.
Computational
- Similarity Algorithm (MARINa (GSEA-2), IDEA, DEMAND, combined, etc.). This entry will combine the algorithm used with the distance method used, e.g. GSEA-2, in the case where an algorithm has more than one possible measure.
Query Controls
- Max Results (checkbox and adjacent text field) - when checked, use the number n entered in the adjacent text field to restrict the returned results to those with the top n scores.
- Search - Search the database for all results matching the constraints, and display the result in the spreadsheet view.
- Reset - Reset all constraints to their default values and clear the lower spreadsheet display.
- Color Gradient for Score (checkbox) - if checked, color the cells in the Score column of the spreadsheet view with the same color that would be used for that result in the Heat Map display.
Plot Options
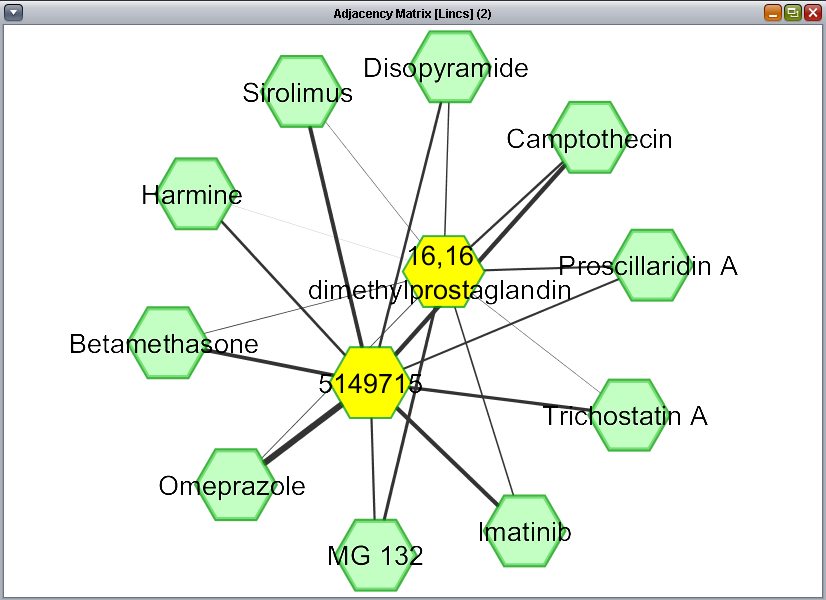
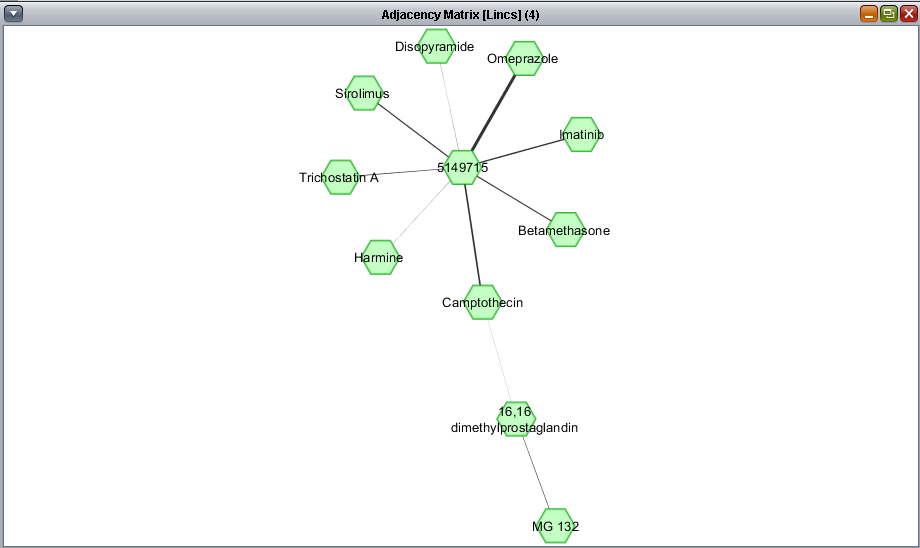
The basic tabular search results can be viewed as a heatmap or as a network graph in Cytoscape.
- Pulldown menu - Choose either Heatmap or Network as the desired plot type.
- Plot - create the heatmap or network display.
- Export - Export the entire tabular result display to a CSV format file on disk.
Heatmap (Color Mosaic Component)
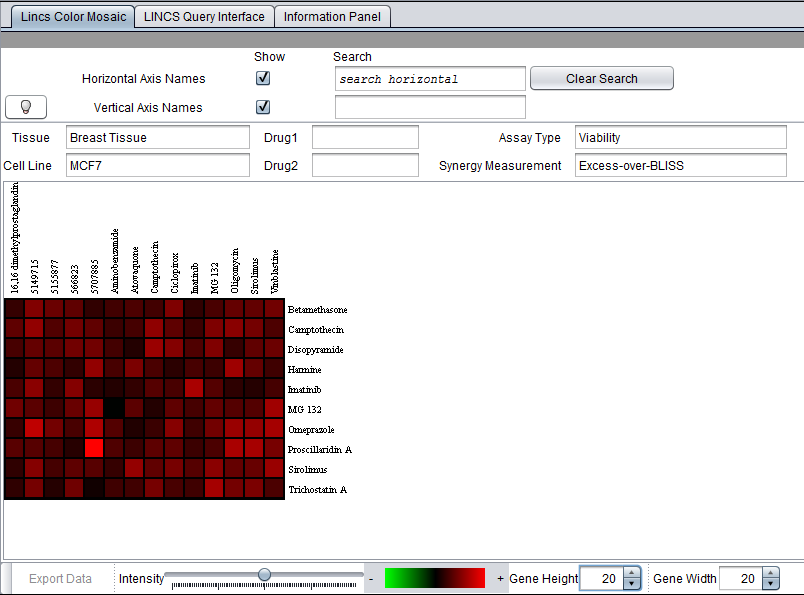
This image shows a heatmap generated from the above search. It is displayed using the geWorkbench Color Mosaic component. The display of the horizontal and vertical axis names has been turned on by checking the corresponding boxes. This also enables the search feature on these names. Clicking on any box brings up a new dialog box offering the choice of viewing underlying titration curves or isobolograms (when available).
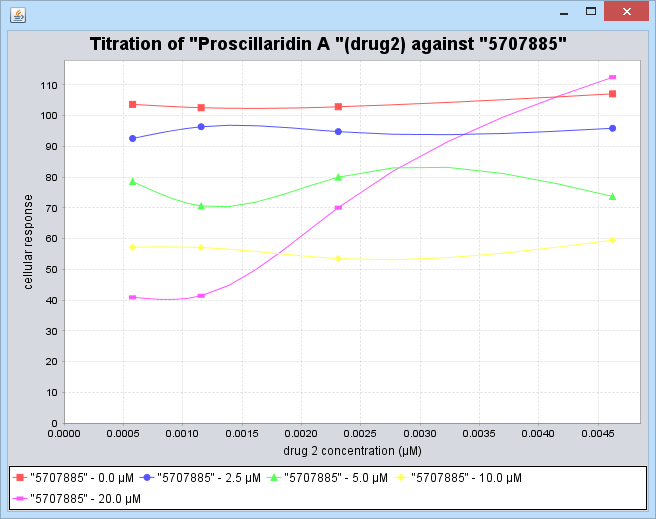
- Double-click for titration graphs - Double-clicking on a cell in the heatmap will bring up a selector which allows the user to choose between plotting the underlying titration curves or an isobologram for the selected drug pair (when available). The selector is shown here:
Note the brightest red square. The titration curves for this data point, "Proscillardin A" (drug 2) vs "5707885" (drug 1) are plotted below in the Titration Curves section.
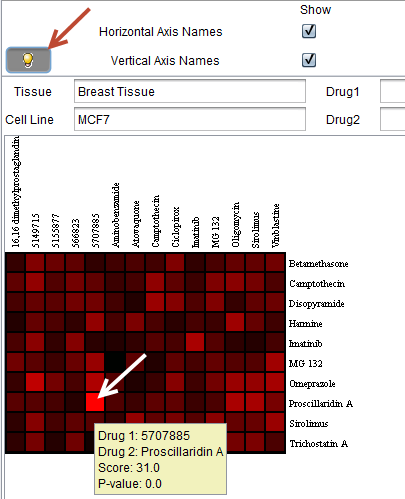
![]() If the bulb icon is toggled on, then when the cursor is hovered over a particular cell in the heat map, extra information will be displayed: the identities of drug 1 and drug 2, the score, and the p-value, as shown below. The cursor was hovered over the brightest red square, already described above. The resulting hover text is depicted below.
If the bulb icon is toggled on, then when the cursor is hovered over a particular cell in the heat map, extra information will be displayed: the identities of drug 1 and drug 2, the score, and the p-value, as shown below. The cursor was hovered over the brightest red square, already described above. The resulting hover text is depicted below.
Search
The horizontal and vertical axis names can be searched on by using the search fields. Matching names will be highlighted. The search is dynamic, occuring as characters are typed. It matches any name containing a string, regardless of where in the name it occurs.
- Horizontal Axis Names - checkbox and search field. When checked, displays the names for the horizontal axis and enables the adjacent search box for searching on these names.
- Vertical Axis Names - checkbox and search field. When checked, displays the names for the vertical axis and enables the adjacent search box for searching on these names.
- Clear Search - clear any highlighted search results.
Heatmap Details
Text fields just below the search controls display the details of the heatmap data. There will always be two blank fields, these correspond to the two free variables. This is even true when multiple selection is used. That is, if a multiple selection is made for drug 1, then its text field will appear empty. The actual values plotted can be seen directly on the heatmap axes.
Network
