Marker Annotations
|
Home | Quick Start | Basics | Menu Bar | Preferences | Component Configuration Manager | Workspace | Information Panel | Local Data Files | File Formats | caArray | Array Sets | Marker Sets | Microarray Dataset Viewers | Filtering | Normalization | Tutorial Data | geWorkbench-web Tutorials |
Analysis Framework | ANOVA | ARACNe | BLAST | Cellular Networks KnowledgeBase | CeRNA/Hermes Query | Classification (KNN, WV) | Color Mosaic | Consensus Clustering | Cytoscape | Cupid | DeMAND | Expression Value Distribution | Fold-Change | Gene Ontology Term Analysis | Gene Ontology Viewer | GenomeSpace | genSpace | Grid Services | GSEA | Hierarchical Clustering | IDEA | Jmol | K-Means Clustering | LINCS Query | Marker Annotations | MarkUs | Master Regulator Analysis | (MRA-FET Method) | (MRA-MARINa Method) | MatrixREDUCE | MINDy | Pattern Discovery | PCA | Promoter Analysis | Pudge | SAM | Sequence Retriever | SkyBase | SkyLine | SOM | SVM | T-Test | Viper Analysis | Volcano Plot |
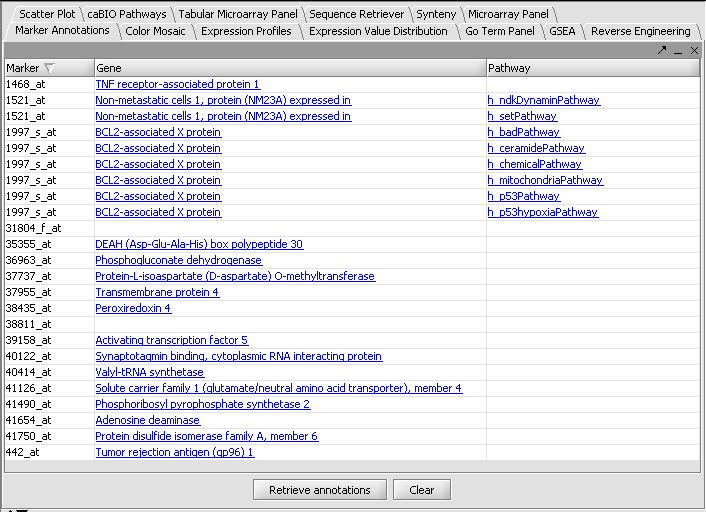
For this tutorial, we will examine the group of markers selected in the Hierarchical Clustering tutorial. geWorkbench can retrieve gene and pathway information from databases hosted at the NCI.
Retrieving selected annotations
1. The desired marker set is activated by checking its box in the Marker Sets component.
2. In the Marker Annotations panel, select Retrieve Annotations.
Displaying annotations and pathway diagrams
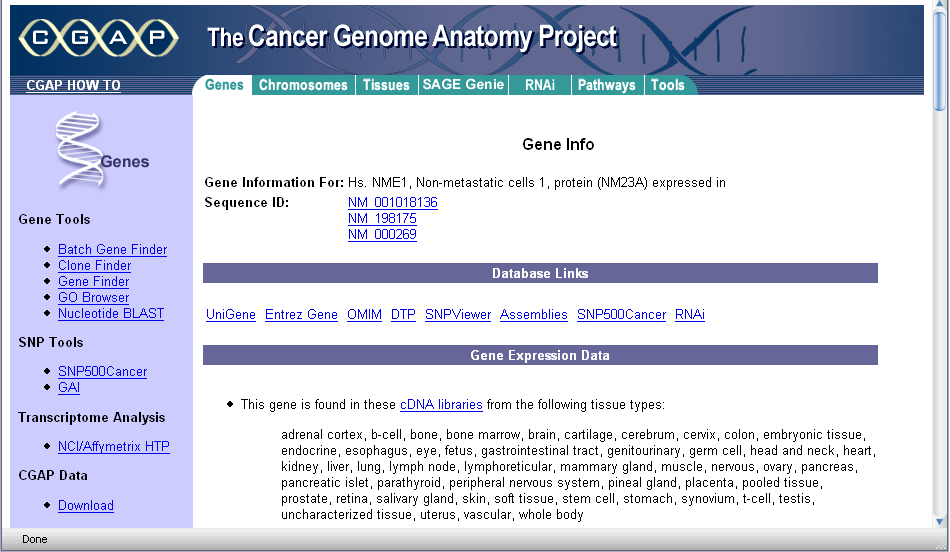
The links under the heading Gene can be clicked to display information from the CGAP database at the NCI:
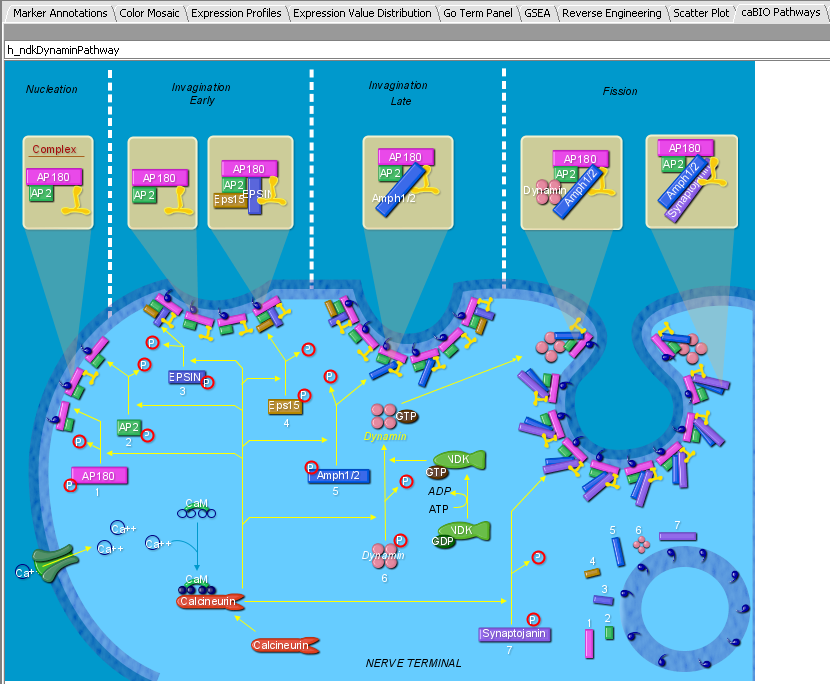
The Pathway links can be clicked to display BioCarta pathway diagrams provided through the NCI's caCORE/caBIO resource. The graphical components are themselves clickable to provide further information.


