Difference between revisions of "Master Regulator Analysis"
m (→Parameters and Settings) |
(→Parameters and Settings) |
||
| Line 15: | Line 15: | ||
# An interaction network in the form of an ARACNe adjacency matrix. It should contain the results of an ARACNe run including, as hub markers, at least all of the transcription factors that will be tested in MRA. | # An interaction network in the form of an ARACNe adjacency matrix. It should contain the results of an ARACNe run including, as hub markers, at least all of the transcription factors that will be tested in MRA. | ||
| − | ==Parameters and Settings== | + | ==MRA Parameters and Settings== |
===Load Network=== | ===Load Network=== | ||
| Line 38: | Line 38: | ||
| − | + | ==t-test Parameters and Settings== | |
The parameter settings available for the MRA t-test are shown in the figure below. These parameters are the same as those described in the [[Tutorial_-_Differential_Expression | t-test component tutorial]]. | The parameter settings available for the MRA t-test are shown in the figure below. These parameters are the same as those described in the [[Tutorial_-_Differential_Expression | t-test component tutorial]]. | ||
| − | + | ===P-values based on=== | |
* t-distribution - directly calculate the p-value | * t-distribution - directly calculate the p-value | ||
* Permutation - determine the p-value empirically through repeated trials against permuted data sets. | * Permutation - determine the p-value empirically through repeated trials against permuted data sets. | ||
| Line 49: | Line 49: | ||
| − | + | ===Correction method=== | |
* Just alpha (no correction) | * Just alpha (no correction) | ||
* Standard Bonferroni - divide given p-value threshold by number of markers tested. | * Standard Bonferroni - divide given p-value threshold by number of markers tested. | ||
| Line 55: | Line 55: | ||
| − | + | ===Step-down Westfall and Young methods=== | |
(only if permuation is selected for p-value calculation) | (only if permuation is selected for p-value calculation) | ||
* minP | * minP | ||
* maxT | * maxT | ||
| − | + | ===Group Variances=== | |
Choose whether the variances in the two groups being compared are expected to be equal or not. | Choose whether the variances in the two groups being compared are expected to be equal or not. | ||
* Unequal (Welch approximation) | * Unequal (Welch approximation) | ||
Revision as of 13:57, 15 July 2009
|
Home | Quick Start | Basics | Menu Bar | Preferences | Component Configuration Manager | Workspace | Information Panel | Local Data Files | File Formats | caArray | Array Sets | Marker Sets | Microarray Dataset Viewers | Filtering | Normalization | Tutorial Data | geWorkbench-web Tutorials |
Analysis Framework | ANOVA | ARACNe | BLAST | Cellular Networks KnowledgeBase | CeRNA/Hermes Query | Classification (KNN, WV) | Color Mosaic | Consensus Clustering | Cytoscape | Cupid | DeMAND | Expression Value Distribution | Fold-Change | Gene Ontology Term Analysis | Gene Ontology Viewer | GenomeSpace | genSpace | Grid Services | GSEA | Hierarchical Clustering | IDEA | Jmol | K-Means Clustering | LINCS Query | Marker Annotations | MarkUs | Master Regulator Analysis | (MRA-FET Method) | (MRA-MARINa Method) | MatrixREDUCE | MINDy | Pattern Discovery | PCA | Promoter Analysis | Pudge | SAM | Sequence Retriever | SkyBase | SkyLine | SOM | SVM | T-Test | Viper Analysis | Volcano Plot |
Contents
Overview
The goal of Master Regulator Analysis (MRA)is to identify transcription factors (TFs) which control the regulation of a set of target genes (TGs) that demonstrate significant differential expression across two cellular phenotypes, e.g. “Case” and “Control” in a microarray dataset. Differential expression is measured using a simple t-test. Sets of genes putatively controlled by each TF (each TF's regulon) are obtained from an adjacency matrix (interaction network) calculated by ARACNe or other source prior to MRA.
The dataset from which the adjacency matrix is derived would not necessarily be the same one used for the t-test. An ARACNe run requires a dataset which explores many different expression phenotypes of a particular cell type, whereas a differential expression experiment compares only two classes.
For each TF, MRA then calculates, using Fisher's Exact test, whether there is greater overlap between the set of the TF's target genes and the set of differentially expressed genes than would be expected by chance.
The types of data which will be used in the MRA then are:
- A microarray dataset appropriate for examining differential gene expression using a t-test.
- A list of putative transcription factors which are to be tested against the differentially expressed genes.
- An interaction network in the form of an ARACNe adjacency matrix. It should contain the results of an ARACNe run including, as hub markers, at least all of the transcription factors that will be tested in MRA.
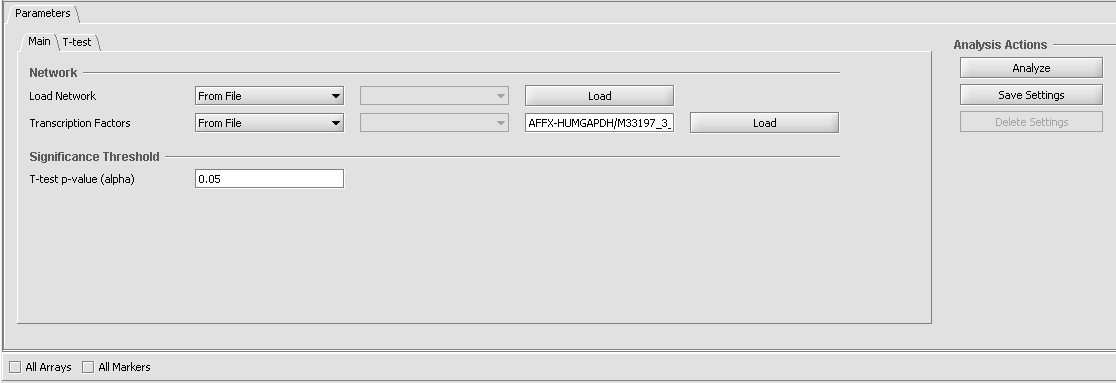
MRA Parameters and Settings
Load Network
The network consists of an adjacency matrix generated by ARACNe.
- From File - load an adjacency matrix generated by an external run of ARACNe.
- From Project - load an ARACNe adjacency matrix from a result node in the Project Folders component.
Transcription Factors
- From File - Load a comma-separate list of transcription factors from a file.
- From Sets - Use a set defined in the Markers component as the list of transcription factors.
Significance Threshold
- T-test p-value (alpha) - The cutoff p-value by which to establish whether a particular marker shows a significant difference in expression between the two groups. (Note that multiple testing corrections are offered on the t-test parameters tab).
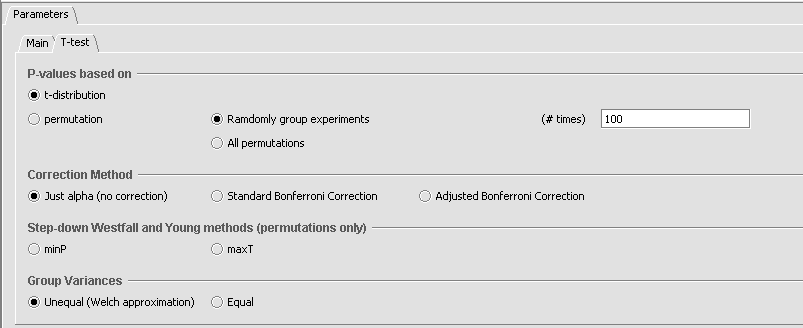
t-test Parameters and Settings
The parameter settings available for the MRA t-test are shown in the figure below. These parameters are the same as those described in the t-test component tutorial.
P-values based on
- t-distribution - directly calculate the p-value
- Permutation - determine the p-value empirically through repeated trials against permuted data sets.
- Randomly group experiments - #-times - how many permuations to carry out
- All permutations
Correction method
- Just alpha (no correction)
- Standard Bonferroni - divide given p-value threshold by number of markers tested.
- Adjusted Bonferroni - same as Standard Bonferroni, except the divisor for each successive marker tested is decreased by one.
Step-down Westfall and Young methods
(only if permuation is selected for p-value calculation)
- minP
- maxT
Group Variances
Choose whether the variances in the two groups being compared are expected to be equal or not.
- Unequal (Welch approximation)
- Equal
Multiple testing considerations
- t-test - The t-test for differential expression is run on each marker in turn, so that potentially thousands of tests may be performed. The t-test tab within MRA offers simple multiple testing corrections such as the Bonferroni correction.
- Fisher's Exact Test - Note that Fisher's Exact test is run for each transcription factor and a p-value reported. No correction is supplied for this occurrence of multiple testing.
Running MRA
- Select or load an adjacency matrix from an ARACNe run or other source.
- Select or load a list of transcription factors.
- Define two classes of arrays, e.g. case and control in the Arrays/Phenotypes component.
- Set the significance threshold and t-test parameters as desired.
- Press the Analyze button. The t-test followed by the Fisher's Exact tests will be carried out.
- A table and graphic showing transcription factors for whose interactions significant overlap with the set of differentially expressed genes was found will be displayed.


