Master Regulator Analysis
|
Home | Quick Start | Basics | Menu Bar | Preferences | Component Configuration Manager | Workspace | Information Panel | Local Data Files | File Formats | caArray | Array Sets | Marker Sets | Microarray Dataset Viewers | Filtering | Normalization | Tutorial Data | geWorkbench-web Tutorials |
Analysis Framework | ANOVA | ARACNe | BLAST | Cellular Networks KnowledgeBase | CeRNA/Hermes Query | Classification (KNN, WV) | Color Mosaic | Consensus Clustering | Cytoscape | Cupid | DeMAND | Expression Value Distribution | Fold-Change | Gene Ontology Term Analysis | Gene Ontology Viewer | GenomeSpace | genSpace | Grid Services | GSEA | Hierarchical Clustering | IDEA | Jmol | K-Means Clustering | LINCS Query | Marker Annotations | MarkUs | Master Regulator Analysis | (MRA-FET Method) | (MRA-MARINa Method) | MatrixREDUCE | MINDy | Pattern Discovery | PCA | Promoter Analysis | Pudge | SAM | Sequence Retriever | SkyBase | SkyLine | SOM | SVM | T-Test | Viper Analysis | Volcano Plot |
Contents
Overview
The Master Regulator Analysis (MRA) component works with a microarray gene expression dataset. Its goal is to identify transcription factors (TFs) which control the regulation of a set of target genes (TGs) that demonstrate significant differential expression. Differential expression is measured using a simple t-test across 2 cellular phenotypes, e.g. “Case” and “Control”.
The types of data which will be used are:
- The results of a t-test for differential expression on the selected microarray dataset.
- A list of putative transcription factors which are to be tested against the differentially expressed genes.
- An interaction network in the form of an ARACNe adjacency matrix. It should contain the results of an ARACNe run including, as hub markers, at least all of the transcription factors listed above, and computed against the markers (dataset) to be tested for differential expression.
Briefly, the steps which MRA will execute are:
- Run a t-test on the the microarray dataset selected in the Project Folders component.
- For each TF, the set of its nearest neighbors (in the adjacency matrix), that is, those markers showing the closest interaction with it, are tested for overlap with the set of differentially expressed genes using Fisher's Exact test.
- The result is a list of transcription factors whose interactions show a significant overlap with the differentially expressed genes.
Parameters and Settings
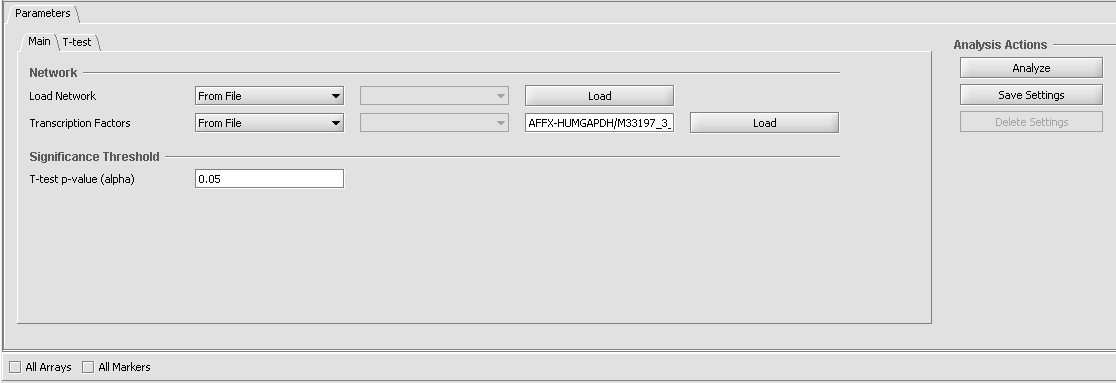
Load Network
The network consists of an adjacency matrix generated by ARACNe.
- From File - load an adjacency matrix generated by an external run of ARACNe.
- From Project - load an ARACNe adjacency matrix from a result node in the Project Folders component.
Transcription Factors
- From File - Load a comma-separate list of transcription factors from a file.
- From Sets - Use a set defined in the Markers component as the list of transcription factors.
Significance Treshold
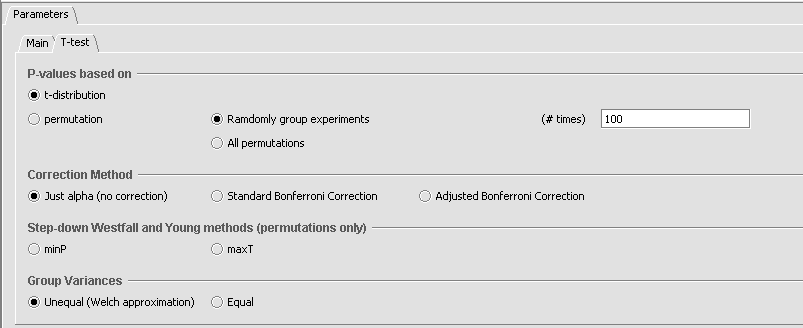
- T-test p-value (alpha) - The cutoff p-value by which to establish whether a particular marker shows a significant difference in expression between the two groups. (Note that multiple testing corrections are offered on the t-test parameters tab).


