MatrixREDUCE
Outline
This tutorial contains
- . an overview of MatrixREDUCE and
- . instructions....
Overview
MatrixREDUCE is a tool for inferring cis-regulatory elements and transcriptional module activities from microarray data. It attempts to calculate a sequence-specific binding affinity for putative transcription factors. The sequence specificity of the transcription factors' DNA-binding domain is modeled using a position-specific affinity matrix (PSAM), representing the change in the binding affinity (Kd) whenever a specific position within a reference binding sequence is mutated. The resulting PSAM can be displayed as an affinity logo or in a simple tabular format.
For further details see STV webpage for MatrixREDUCE.
Data Files
MatrixREDUCE operates on two input files: a microarray data set and a FASTA file containing the DNA sequences corresponding to the regulatory region of genes probed in the microarray set. The gene/probe identifiers used in the microarray dataset and the sequence identifiers used in the FASTA file must match. However, case is not important; the program will change the identifiers to lower case before attempting to match the records. If an identifier appears more than once in a file, the last instance is used.
Parameters
(default values are shown in parantheses)
p_value - p-value threshold to stop looking for new motifs (0.001).
dyad_length - The length of each oligo in the dyad (3).
min_counts - Minimum # of motif counts to be included in regression (5).
min_gap - Minimum gap length between the two oligos in the dyad (0).
flank - Number of nucleotides to either side of the dyad core (3).
max_motif - Maximum # of motifs to search.
max_iteration - Maximum # of iterations in matrix optimization (inf.).
num_print - Number of iterations to print optimized function value.
single_strand - (“Yes”, “No”) Switch for scoring only forward strand.
Graphical Interface
Example
In this example, we will use two files that are included in the data directory of the geWorkbench distribution iteself. They are SpellmanReduced.txt and Y5_600_Bst.fa. SpellmanReduced.txt contains a subset of the data from Spellman XXXXX. Y5_600_Bst.fa contains the corresponding upstream DNA sequences for these genes.
1. In the Project Folders component, either use an existing Project, or create a new one.
2. Right-click on Project and select "Open File(s)".
3. Browse to the file SpellmanReduced.txt and set the file type to "RMA Express, Tab-Delimted". This file is found in the data directory of the geWorkbench installation. Open the file.
4. You will be asked for an annotations file. This is not needed for this example, so you can hit Cancel.
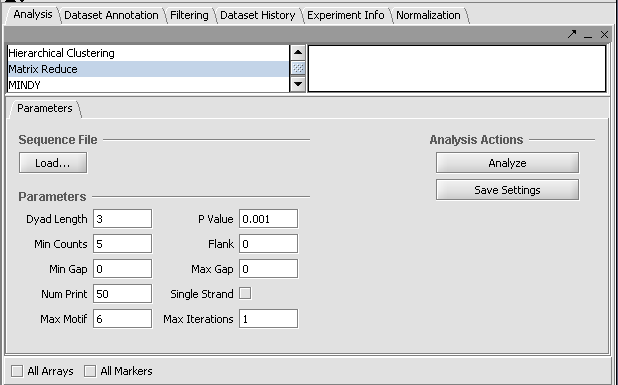
5. Go to the Analysis tab and select Matrix Reduce.
6. Resize the component if needed to see all the parameter input fields. For this quick demonstration, set the parameter Max Motifs to 6 and the Max Iterations to 1.
7. To load the sequence file, click the "Load..." button. Browser to the sequence file "Y5_600_Bst.fa" and open it.
8. Click Analyze to run MatrixREDUCE. (If you are running geWorkbench from a console window using ANT, you can follow the progress of the calculations there).
9. The result is placed as a node beneath the parent microarray dataset in the Project Folders component. At the same time, the results are displayed in the Visual Area of geWorkbench.
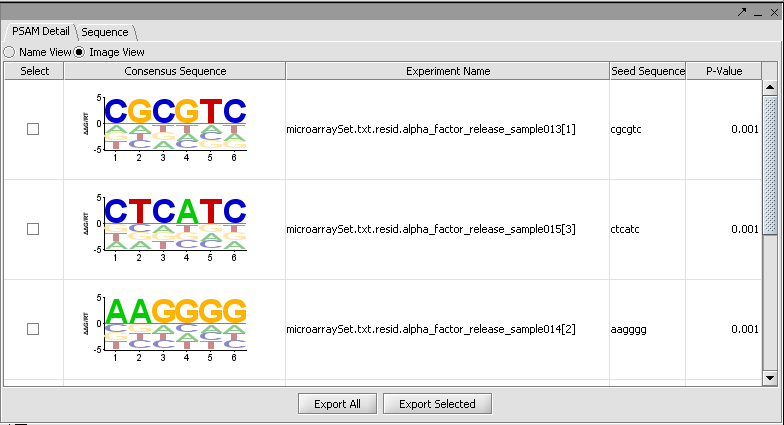
There are two tabs in the viewer, PSAM Detail and Sequence. Within PSAM Detail there are two options. The first is the Image view, which depicts the PSAM graphically.
The second viewing option is the Name view, which just shows the consensus sequence without the weighted components.
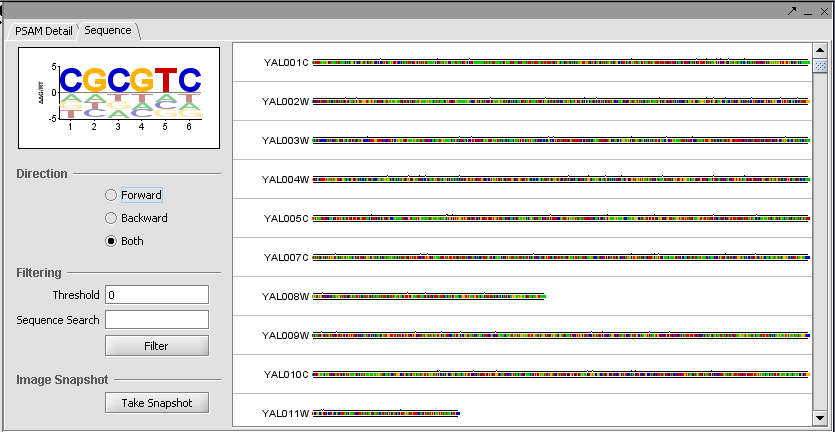
Finally, the Sequence tab depicts scores along each sequence.


