Pattern Discovery
|
Home | Quick Start | Basics | Menu Bar | Preferences | Component Configuration Manager | Workspace | Information Panel | Local Data Files | File Formats | caArray | Array Sets | Marker Sets | Microarray Dataset Viewers | Filtering | Normalization | Tutorial Data | geWorkbench-web Tutorials |
Analysis Framework | ANOVA | ARACNe | BLAST | Cellular Networks KnowledgeBase | CeRNA/Hermes Query | Classification (KNN, WV) | Color Mosaic | Consensus Clustering | Cytoscape | Cupid | DeMAND | Expression Value Distribution | Fold-Change | Gene Ontology Term Analysis | Gene Ontology Viewer | GenomeSpace | genSpace | Grid Services | GSEA | Hierarchical Clustering | IDEA | Jmol | K-Means Clustering | LINCS Query | Marker Annotations | MarkUs | Master Regulator Analysis | (MRA-FET Method) | (MRA-MARINa Method) | MatrixREDUCE | MINDy | Pattern Discovery | PCA | Promoter Analysis | Pudge | SAM | Sequence Retriever | SkyBase | SkyLine | SOM | SVM | T-Test | Viper Analysis | Volcano Plot |
Contents
Outline
In this tutorial, running a pattern discovery algorithm on a set of DNA sequences is described. The steps include:
- Setting parameters
- Creating a new session
- Running the job
- Viewing the results
Background
The geWorkbench Pattern Discovery module uses an algorithm called SPLASH (Califano, 2000) to search for common patterns in sets of DNA or protein sequences. This type of search could be used, for example, to search for common regulatory elements in otherwise unrelated sequences.
For this tutorial, we will begin with the set of 33 sequences retrieved as shown in the Sequence Retrieval tutorial. These sequences derive from a cluster of genes showing similar expression pattern across a number of different experiments.
(Note - there currently is no provision for filtering out repeated sequences from genomic seqeuence. Results should be evaluated in this light).
Setting parameters and running
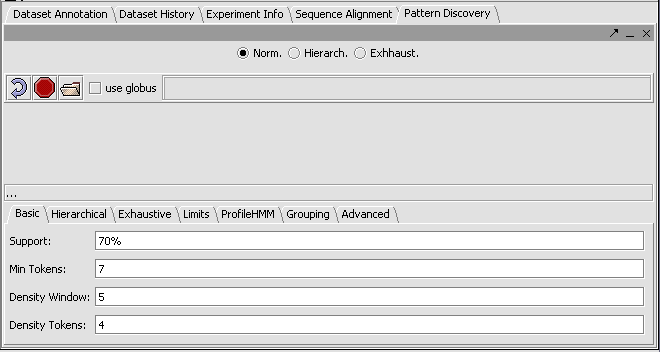
A number of parameters can be adjusted by the user, as shown in the figure, to adjust the sensitivity of the search.
These include:
- Support - Can be input in number of sequences or in % of sequences containing a given motif.
- Min Tokens - The minimum number of characters in a discovered motif.
- Density Window - A sliding window in which at least the number of tokens set in "Density Tokens" must be found.
- Density Tokens - the minimum number of matching characters within the "Density Window".
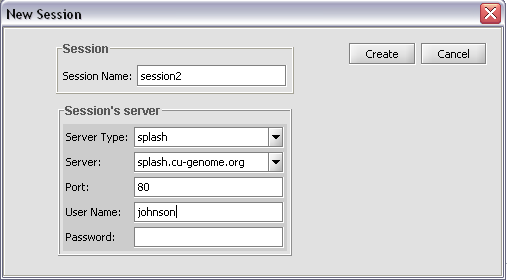
Pushing on the button with the curling arrow icon will bring up the session creation box:
A user name must be entered, but it can be any name.
Push Create to start the search.
Viewing results
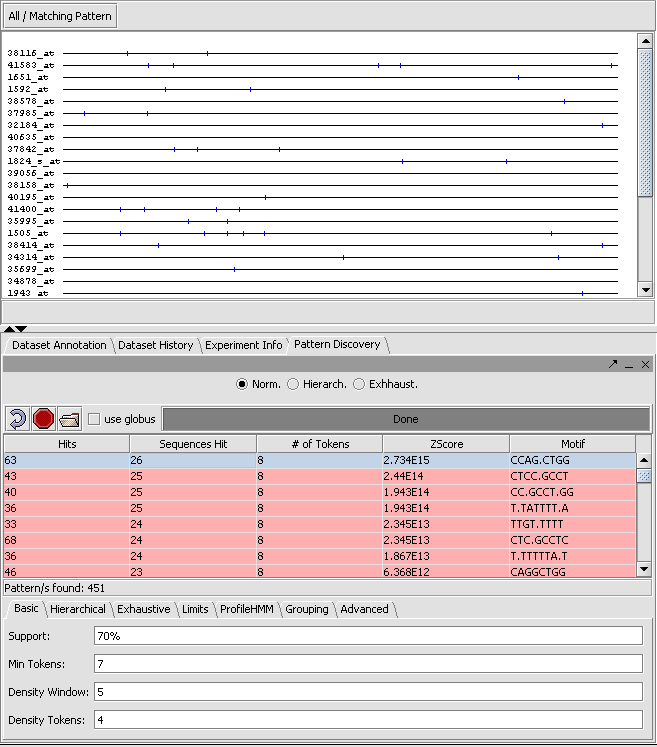
The result of the search can be viewed both in the Pattern Discovery module itself and in other sequence viewer modules such as "Sequence" and "Promoter". In Pattern Discovery the results are returned in a table, and the hits for the motif(s) selected in the table will be displayed superimposed on the sequences above. In this picture, the results were first sorted by Z-Score, and the motif with the highest score displayed.
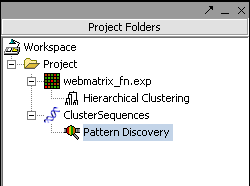
Results are added to the Projects Folder
The results of a run of Pattern Discovery are placed in the Project Folder:
Logical complexities in the display...
- The other sequence display components, including Sequence, Promoter, and Position Histogram, are only available when the parent sequence object is selected in the Project Folder. However, even then, the results of the Pattern Discovery run are still available in that component.
- Selecting another sequence object will cause the Pattern Discovery component to be cleared. However, the results can be reloaded by again selecting the Pattern Discovery result in the Project Folder.
References
Calfano, A. (2000). SPLASH: structural pattern localization analysis by sequential histograms. Bioinformatics, Apr;16(4):341-57.


