SAM

Revision as of 17:50, 22 October 2013 by Smith (talk | contribs) (SAM Results Viewer)

Home | Quick Start | Basics | Menu Bar | Preferences | Component Configuration Manager | Workspace | Information Panel | Local Data Files | File Formats | caArray | Array Sets | Marker Sets | Microarray Dataset Viewers | Filtering | Normalization | Tutorial Data | geWorkbench-web Tutorials

Analysis Framework | ANOVA | ARACNe | BLAST | Cellular Networks KnowledgeBase | CeRNA/Hermes Query | Classification (KNN, WV) | Color Mosaic | Consensus Clustering | Cytoscape | Cupid | DeMAND | Expression Value Distribution | Fold-Change | Gene Ontology Term Analysis | Gene Ontology Viewer | GenomeSpace | genSpace | Grid Services | GSEA | Hierarchical Clustering | IDEA | Jmol | K-Means Clustering | LINCS Query | Marker Annotations | MarkUs | Master Regulator Analysis | (MRA-FET Method) | (MRA-MARINa Method) | MatrixREDUCE | MINDy | Pattern Discovery | PCA | Promoter Analysis | Pudge | SAM | Sequence Retriever | SkyBase | SkyLine | SOM | SVM | T-Test | Viper Analysis | Volcano Plot


SAM - Significance Analysis of Microarrays

Local Installation of R Server

The SAM analysis component can use a local installation of R on your desktop computer.

This has been tested with R version 2.15.0 and 3.0.2.

There are special considerations for installing R on Windows computers, please see R installation on Windows.

Setting the R location in geWorkbench is covered at Preferences: R Location.


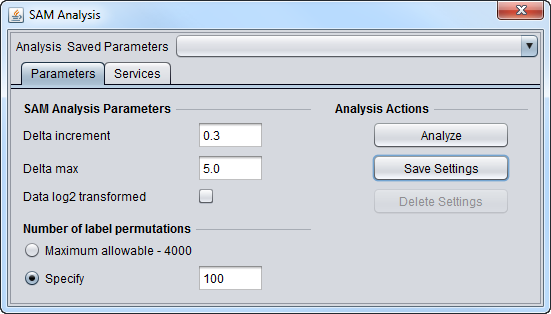
SAM Parameters

SAM Analysis Parameters.png


SAM Results Viewer

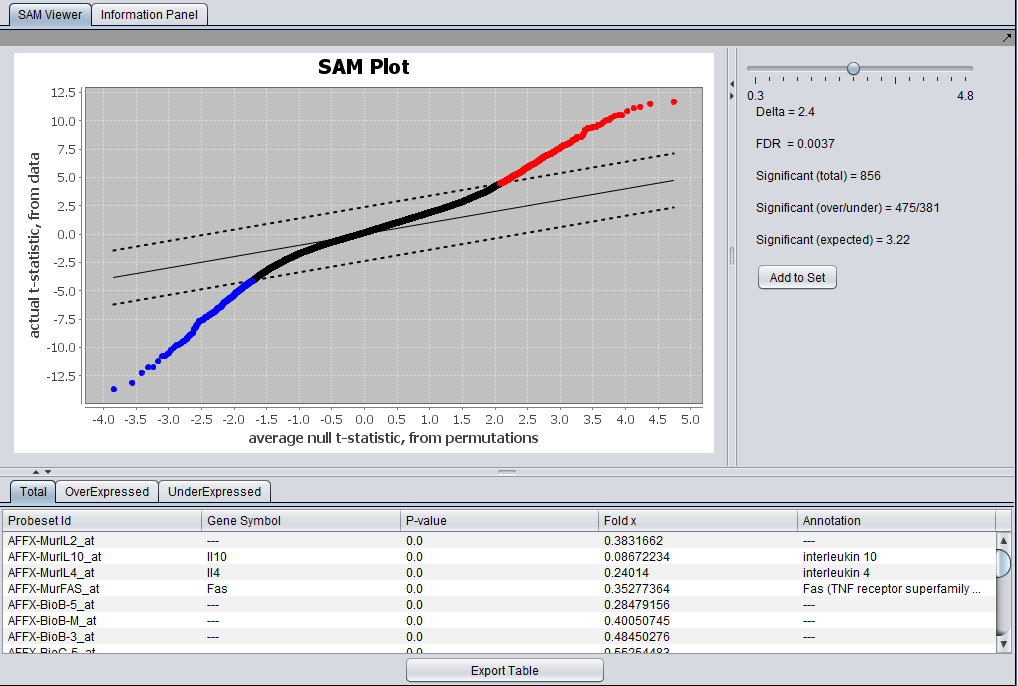
The Full SAM Reults viewer is shown here.

SAM Viewer full.png


The results can be sorted, e.g. on the fold change value as shown below.
SAM Viewer Overexpressed.png