Difference between revisions of "Tutorial - Filtering and Normalizing"
(→Normalize) |
(→Filter) |
||
| Line 12: | Line 12: | ||
==Filter== | ==Filter== | ||
| − | Filtering can be used to | + | Filtering can be used to remove low quality data or reduce the size of the dataset by removing less interesting data. Available geWorkbench filters are as follows: |
| Line 66: | Line 66: | ||
|- | |- | ||
|} | |} | ||
| − | |||
==Normalize== | ==Normalize== | ||
Revision as of 15:51, 28 April 2006
Contents
Filter and Normalize Data
In this tutorial, you will:
- Get acquainted with the various filters and normalizers available in geWorkbench
- Apply a filter and normalizer on a tutorial dataset
Before you can continue, geWorkbench should be running. Load a microarray data file such as webmatrix.exp or cardiomyopathy.exp . Please refer to Tutorial - Projects and Data Files tutorial if you need assistance loading a file.
Filter
Filtering can be used to remove low quality data or reduce the size of the dataset by removing less interesting data. Available geWorkbench filters are as follows:
| Filter | Description | |
|---|---|---|
| Affy Detection Call | Applicable to Affymetrix data only. Sets all measurements whose detection status is any user-defined combination of A, P or M as missing. | |
| Missing values | Discards all markers that have “missing” measurements in at least n microarrays, where n is defined by the user. Another filter must first be applied however, in order to generate the missing values upon which this filter can operate. | |
| Deviation | Sets all markers whose measurements deviate below a given value across all microarrays as missing. | |
| Expression Threshold | Sets all markers whose measurements are inside (or outside) a user-defined range as missing. | |
| 2 Channel | Applicable to 2-channel arrays (Genepix) data only. Defines applicable ranges for each channel, and sets all values for which either channel intensity is inside (or outside) the defined range as missing. |
Perform the following steps to filter out data called absent in an Affymetrix file:
- In the Filtering Panel, select Affy Detection Call Filter.
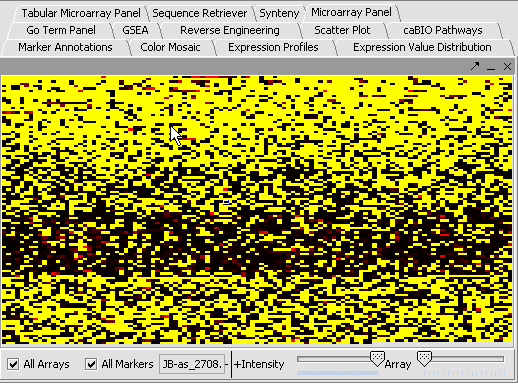
- Select ‘A’ (Absent) checkbox and Filter. Values that were removed (marked as missing) are highlighted in yellow.
- In the Filtering Panel, select Missing Values Filter.
- Choose the maximum number of arrays that can have missing values before marker is removed – default is 0.
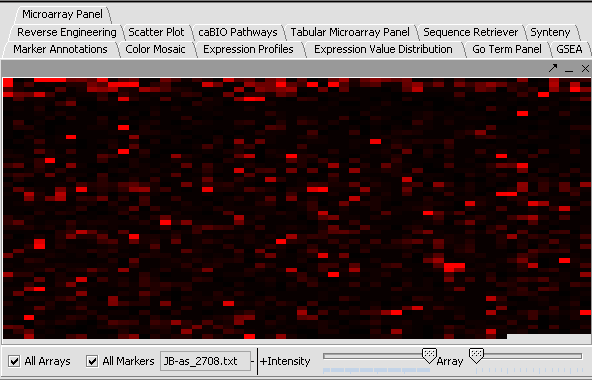
- Click Filter. Markers with more than 0 missing values are removed. You’ll notice the yellow values are gone
| Affy Detection Call Filter | Missing Values Filter | |
|---|---|---|
 |

|
Normalize
Normalization can be used to decrease the effects of systematic differences across a set of experiments. In geWorkbench, normalization results in replacing values with new values. Available geWorkbench normalization methods are as follows:
| Normalizer | Description | |
|---|---|---|
| Missing value calculation | Replaces every missing value with either the mean value of that marker across all microarrays or with the mean measurement of all markers in the microarray where the missing value is observed | |
| Log2 Transformation | Applies a log2 transformation to all measurements in a microarray | |
| Threshold Normalizer | All data points whose value is less than (or greater than) a user-specified minimum (maximum) value are raised (reduced) to that minimum (maximum) value | |
| Marker-based Centering | Subtracts the mean (median) measurement of a marker profile from every measurement in the profile | |
| Array-based centering | Subtracts the mean (median) measurement of a microarray from every measurement in that microarray | |
| Mean-variance normalizer | For every marker profile, the mean measurement of the entire profile is subtracted from each measurement in the profile and the resulting value is divided by the standard deviation |
Apply Quantile Normalizer
1. In the Normalization Panel, select Quantile Normalizer.
2. Leave the default averaging method of Mean Profile Marker to indicate handling of missing values..
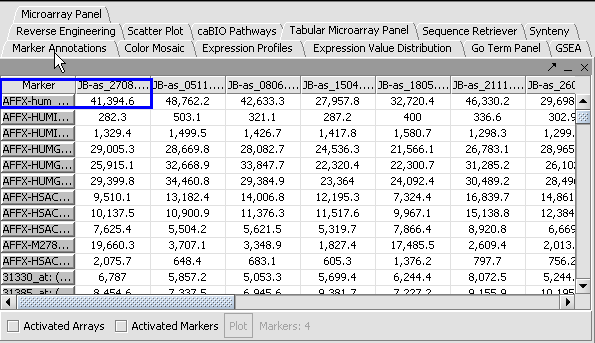
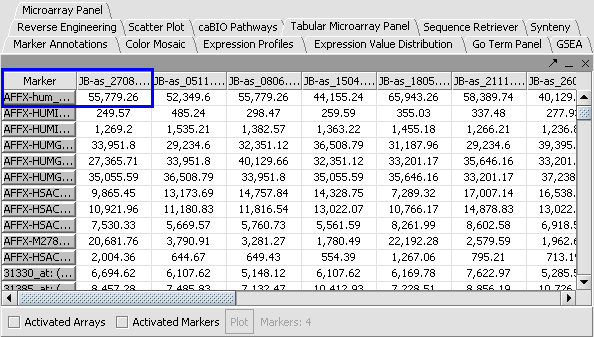
3. Click Normalize. The View Area is updated to reflect normalization (after the screen has been refreshed). Note: The first value in the second row was update from 41,394.6 to 55,779.26.
| PRENORMALIZATION | NORMALIZED | |
|---|---|---|
 |
 . .
|


