Tutorial - GO Term Enrichment
Overview
The Gene Ontology component allows the exploration of the Gene Ontology (GO) terms represented within a list of genes. Several different display options are available. The entire GO can be displayed as a tree (TreeView), with the selected genes being shown within the tree. Or, the list of genes can be displayed sorted by their overrepresentation P-values (TableView). This P-value is calculated from the observed vs expected number of hits to a category based on its representation in markers annotated in the microarray type as a whole, e.g. HG_U95Av2.
Example
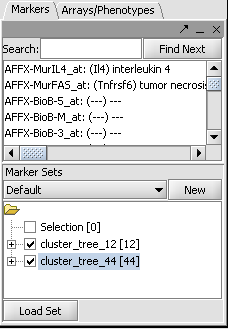
In this example we will use the file "webmatrix_quantile_log2_dev1_mv0.exp" available in the tutorial data section (coming soon). The lists of markers were obtained as shown in the Clustering tutorial. The first contains 12 markers and the second 44, comprising together one larger cluster. The marker lists can also be directly loaded from the files cluster_tree_12.csv and cluster_tree_44.csv found in the tutorial data section (coming soon).
- Activate both of the lists by checking their boxes in the Markers component as shown:
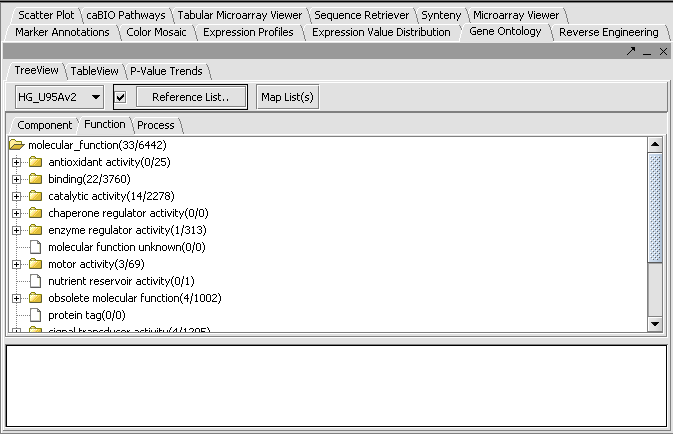
- In the Gene Ontology component, choose the type of GO term that one wants, either Component, Function or Process. In this example we will select the Process tab.
- Click on Map List(s).
- We see in the picture below that 33 of the 56 total markers were placed in functional categories. By scrolling and by clicking on individual tree nodes, we can explore the tree. We see that the largest single category, with 23 hits, was binding.
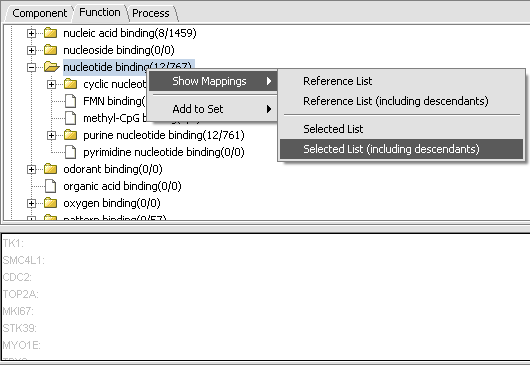
By clicking on the binding node, we can travel down to increasing levels of detail. By right-clicking on a folder icon and selecting Show Mappings->Selected List(including descendents) as shown below, we can see the gene names of the 12 genes categorized at that level.
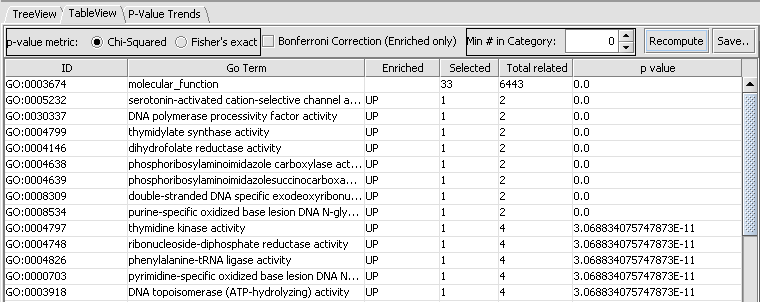
A second view of the data is available by clicking on the TableView tab. This will show the degree of overrepresentation in GO categories. Here is the data for the Function category for the same list as above:
Note the Save button at right on the component. This will dump the entire contents of the table to a text file with extension .dat.


