Master Regulator Analysis
|
Home | Quick Start | Basics | Menu Bar | Preferences | Component Configuration Manager | Workspace | Information Panel | Local Data Files | File Formats | caArray | Array Sets | Marker Sets | Microarray Dataset Viewers | Filtering | Normalization | Tutorial Data | geWorkbench-web Tutorials |
Analysis Framework | ANOVA | ARACNe | BLAST | Cellular Networks KnowledgeBase | CeRNA/Hermes Query | Classification (KNN, WV) | Color Mosaic | Consensus Clustering | Cytoscape | Cupid | DeMAND | Expression Value Distribution | Fold-Change | Gene Ontology Term Analysis | Gene Ontology Viewer | GenomeSpace | genSpace | Grid Services | GSEA | Hierarchical Clustering | IDEA | Jmol | K-Means Clustering | LINCS Query | Marker Annotations | MarkUs | Master Regulator Analysis | (MRA-FET Method) | (MRA-MARINa Method) | MatrixREDUCE | MINDy | Pattern Discovery | PCA | Promoter Analysis | Pudge | SAM | Sequence Retriever | SkyBase | SkyLine | SOM | SVM | T-Test | Viper Analysis | Volcano Plot |
Contents
Overview
Regulatory activity in the context of specific cellular phenotypes can be investigated using interaction networks. These are graphs where nodes represent genes and an edge between two nodes A and B means that genes A and B are participants in the same regulatory activity. E.g., A can be a transcription factor for B; or, A can be an miRNA that silences B. Analysis of such regulatory networks [Basso et al., 2005] has convincingly demonstrated their scale-free nature which is dominated by a relatively small number of nodes with a large degree of connectivity. The genes corresponding to those nodes are known as "master regulators" and collectively orchestrate the regulatory program of the underlying cellular phenotype(s).
Master Regulator analysis [Lefebvre et al., 2010] is an algorithm used to identify transcription factors whose targets (e.g., as represented in an ARACNe-generated interactome) are enriched for a particular gene signature. The enrichment is evaluated using a statistical test such as Fisher’s exact test. The objective is to place the signature genes within a regulatory context and identify the master regulators responsible for coordinating their activity, thus highlighting the regulatory apparatus driving phenotypic differentiation.
Specifically, given an interaction network I, a (presumed) master regulator gene A, and a set of signature genes, MRA computes the intersection between two sets of genes:
- The neighbors of A in the interaction network I (this gene set is called the regulon of A).
- The set of signature genes. The signature may be supplied independently or calculated from e.g. a differential expression experiment.
Interaction networks are represented as "adjacency matrices". An adjacency matrix lists the connections that each node takes part in, and includes a measure of the strength of that interaction (e.g. the mutual information in the case of matrices generated by ARACNe).
Fisher’s exact test is used to quantify how likely it is to encounter an intersection of (at least) the observed size by chance alone. A small p-value is taken to imply that gene A may play a significant role in mediating the regulatory program that leads to the differential phenotypes.
Generating a display of the effect of a master regulator on its regulon requires performing a t-test of differential expression on a dataset representing the phenotypes distinguished by the signature, ideally the original dataset from which the signature was determined.
Setting up an MRA run
Prerequisites
- The Master Regulator Analysis (MRA) component must be loaded in the Component Configuration Manager.
- The MRA component will be listed along with the other analysis routines within the geWorkbench Analysis Panel.
- Interaction Network - An interaction network calculated with ARACNe from a dataset which includes the particular cellular phenotypes being investigated. In calculating the network, all genes that will be tested as possible master regulators should be used as hubs in the ARACNe calculation.
- Signature genes - A list of signature genes which distinguish between two phenotypes. This list may come from a t-test, clustering, or some combination of methods. The user must define this set using methods relevant to the particular dataset and study goals.
- Candidate master regulator list - A set of genes that will be tested as candidate master regulators. This set may be comprised of e.g. transcription factor and signalling pathway genes.
- Gene Expression dataset - A gene expression dataset in which the phenotypic signature was identified or can be demonstrated. A t-test of differential expression will be run to generate the graphic "bar code" display of the effect of the master regulator on its regulon.
Parameters and Settings
Load Network
There are 2 ways to designate the interaction network, represented by an adjacency matrix, that will be used for computing the regulons of the candidate master regulator genes:
- From File: by choosing a file that describes a network.
- From Project: by selecting an adjacency matrix node from the Project Folders component. Several analytical components in geWorkbench (e.g., ARACNE) produce adjacency matrix results nodes that can be utilized for this purpose.
All edges in the network are assumed to be significant, and any strength value included is not used.
Master Regulators
A set of candidate master regulator markers. This set must be loaded into the Markers component before running MRA. This can be read in either directly as markers, or as gene symbols.
Signature Markers
A set of markers comprising the signature that distinguishes the chosen phenotype from others. This set must be loaded into the Markers component before running MRA. It can be read in either directly as markers, or as gene symbols (but be aware that a gene can be represented by more than one marker, and not all may correspond to the signature).
Fisher's Exact Test threshold
Enter a p-value for the significance at which to accept the overlap of the regulon of a candidate TF and the signature set of genes.
T-test for differential expression
A "bar-code" graphic is generated using a t-test on a differential expression dataset. However, all t-values are accepted (critical alpha = 1) and used to order the bars representing the regulon markers.
All that is required is to define sets of arrays representing two phenotypes of interest (and distinguished by the signature). At least two sets of arrays must be activated, and at least one marked as "case", representing the target phenotype of the gene signature. "Control" is the default classification. See also the Differential Expression tutorial).
Viewing MRA analysis results
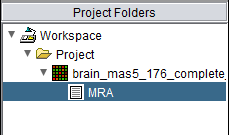
Following the successful completion of the MRA computation, a result node appears in the Project Folder area of the geWorkbench interface, under the microarray experiment node used for the t-test:
The results of the analysis can be visualized in the MRA Viewer component by selecting the result node.
MRA Results Viewer
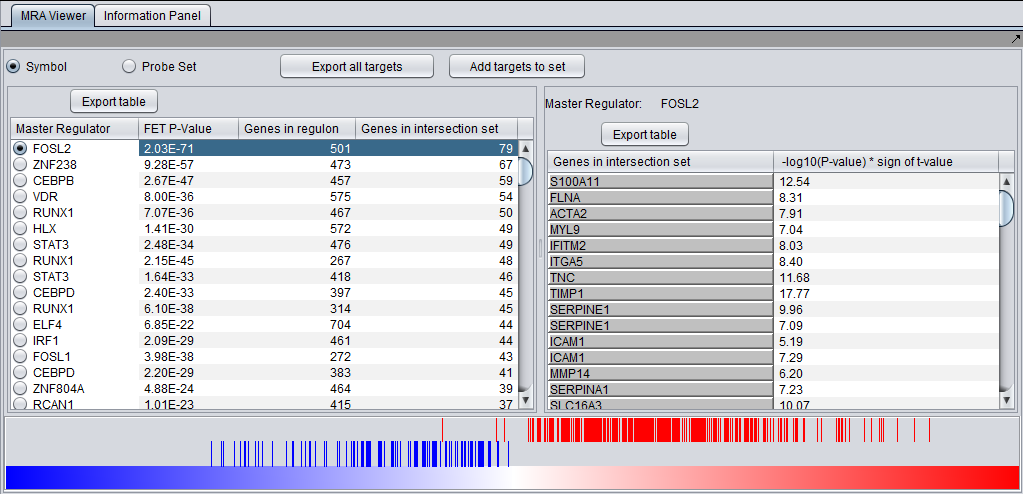
The MRA viewer is structured in 3 distinct areas.
Summary Listing
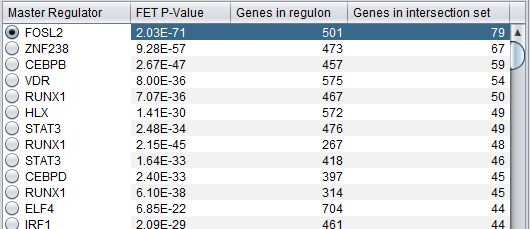
At upper left in the MRA viewer. For each candidate master regulator found to have a significant effect using Fisher's Exact test, the following four columns are displayed:
- Master Regulator - This is either the master regulator gene name or the marker/probeset name identifying the corresponding array feature (depending on the selection of the radio buttons “Symbol” and “Probe set”).
- FET p-value - the p-value from Fisher’s exact test. The test utilizes a 2x2 contingency table where rows classify markers as belonging to the signature set or not, while columns indicate if a marker belongs to the regulon of the master regulator or not. Counts are computed using all markers found in the input experiment data. (Fischer's exact test includes p-values for more-extreme tables).
- Genes in Regulon - the number of markers (genes) found to be first neighbors of the master regulator in the loaded network - its regulon.
- Genes in Intersection Set - The number of markers found in the intersection of the signature and the regulon of the candidate MR.
The contents of the table can be ordered by any column, by clicking on the column name.
Clicking on the radio button for any of the master regulators will display the list of intersection genes in a table to the right (Detailed Listing), and will draw the regulon bar graph below.
Detailed Listing
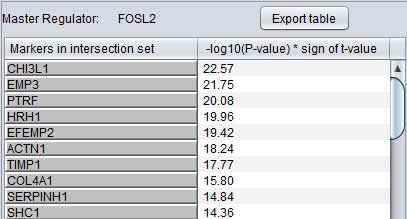
The detailed list shows the genes/markers contained in the intersection set of the MR regulon and the signature.
The genes are displayed in a table with the following columns:
- Genes in intersection set: the names of the genes in the intersection set. Either the gene name or the marker/probe set name is used (based on the choice of "Symbol" or "Probe Set" radio buttons).
- T-test value: The actual value of the t-test statistic for the gene. A positive value indicates that the expression of the gene is higher in cases than in controls. A negative value has the opposite meaning.
Graph View
For a given master regulator A and the intersection between its regulon and the set of differentially expressed genes, the graph view helps assess if the intersection genes are preferentially over-expressed in the cases versus the controls. The biological motivation comes from observing [Lim et al., 2009] that regulators with multiple targets tend to affect the expression level of (most of) their targets in one particular direction: they either promote their expression or inhibit it; but they rarely do both equally.
- The red-blue gradient at the bottom of the graph represents the range between the lowest (blue) and the highest (red) t-test statistic recorded among all differentially expressed genes. The white area in the middle represents zero.
- The vertical bars correspond to the genes displayed in the table under the “Detailed listing” portion of the interface, i.e., the intersection between the differentially expressed genes and the regulon of the master regulator A currently selected within the “Summary listing” table.
- The relative location of a bar on the gradient represents the t-test statistic recorded for the corresponding gene.
- Further, the color of each bar provides information about the correlation between the expression levels of the target gene and the putative master regulator A (correlations are computed as Pearson’s correlation, using data from all microarrays in the experiment): red means that the two genes are positively correlated (r > 0) while blue means that correlation is negative (r < 0).
FOSL2:
The bar graph shown above, for FOSL2, indicates that more of its regulon genes have positive differential expression in the mesenchymal phenotype, and that expression of FOSL2 is positively correlated with the differential expression of its regulon in the mesenchymal phenotype.
ZNF238:
The bar graph shown above, for ZNF238, indicates that expression of ZNF238 is negatively correlated with the differential expression of its regulon in the mesenchymal phenotype.
Control buttons
Additional functionality is made available through the following buttons:
- Add to Set: creates a set containing the markers that correspond to the genes currently displayed in the table. The new marker set appears in the Markers component and is named after the master regulator.
- Export selected: same as “Add to Set” but instead of being added to a marker set, the markers are stored into a file.
- Export all: stores into a file information for all master regulators (instead of only the one currently selected in the “Summary” view). Specifically, for each master regulator, the file lists the markers for all genes that are both differential expressed and also belong to the master regulator’s regulon.
Dataset History
Each results node stores the parameter settings used to setup the corresponding MRA run. The specific parameter values can be inspected within the Dataset History component, after clicking on the MRA results node in the Project Folders pane.
Example of running MRA
This example uses a dataset comprised of 176 microarrays described in Phillips (2006). The analysis follows that described in Carro et al. (2010) for master regulators of Glioblastoma.
Loading and preparing the example data
Microarray dataset
- Load a microarray dataset. (See Local Data Files).
- When prompted, load the annotation file.
Marker sets
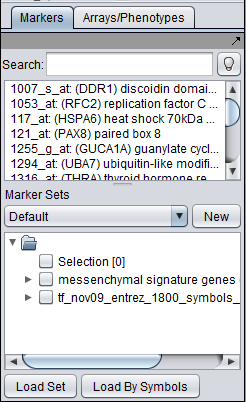
Load marker sets for:
- the list of candidate master regulators
- the signature genes.
Array sets
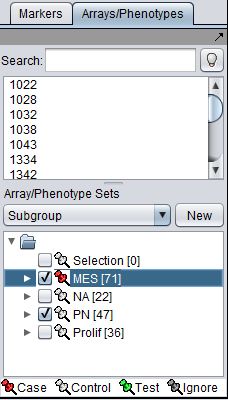
Array sets are shown defined for the three phenotypic classes of arrays in the dataset: Mesenchymal (MES), Proneural (PN), and Proliferative (Prolif).
- MES and PN are "activated" for use in the t-test by checking the boxes next their names.
- The MES set is classifed as "Case". Right click on the thumbtack adjacent to the set name.
Setting up the parameters and starting MRA
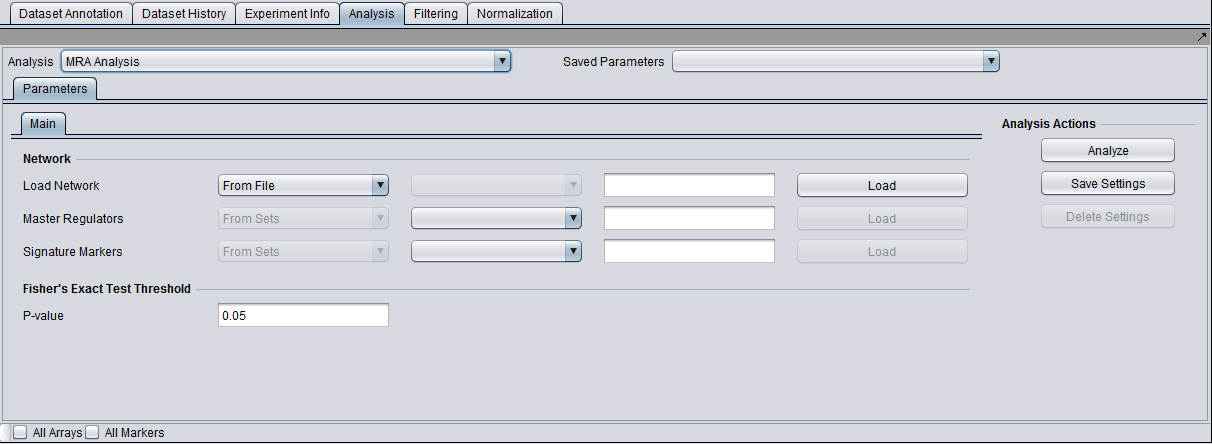
In the Analysis Panel, select the "MRA Analysis" entry and set the parameters as follows:
- Load Network - from the drop down choose the option "From Set", click on the "Load" button, and select the desired set.
- Master regulators - select the desired set from those loaded in the Markers component.
- Signature markers - select the desired set from those loaded in the Markers component.
- P-value - The p-value for the FET may be set as desired.
- Click on the Analyze button.
Results
Upon completion of the analysis, an MRA results node is placed in the Project Folders tree. The analysis results can be browsed using the MRA viewer and are as shown above in the MRA Results Viewer section.
References
- Basso K, Margolin AA, Stolovitzky G, Klein U, Dalla-Favera R, Califano A (2005). Reverse engineering of regulatory networks in human B cells. Nat Genet 37(4):382-390 (link to paper).
- Carro MS, Lim WK, Alvarez MJ, Bollo RJ, Zhao X, Snyder EY, Sulman EP, Anne SL, Doetsch F, Colman H, Lasorella A, Aldape K, Califano A, Iavarone A (2010) The transcriptional network for mesenchymal transformation of brain tumors. Nature 463(7279):318-25.
- Lefebvre C, Rajbhandari P, Alvarez MJ, Bandaru P, Lim WK, Sato M, Wang K, Sumazin P, Kustagi M, Bisikirska BC, Basso K, Beltrao P, Krogan N, Gautier J, Dalla-Favera R, Califano A (2010) A human B-cell interactome identifies MYB and FOXM1 as master regulators of proliferation in germinal centers. Mol Syst Biol. 6:377. PMID: 20531406 (link to paper).
- Lim WK, Lyashenko E, Califano A: Master regulators used as breast cancer metastasis classifier. Pac Symp Biocomput. 2009:504-15 (link to paper).
- Phillips HS, Kharbanda S, Chen R, Forrest WF, Soriano RH, Wu TD, Misra A, Nigro JM, Colman H, Soroceanu L, Williams PM, Modrusan Z, Feuerstein BG, Aldape K (2006) Molecular subclasses of high-grade glioma predict prognosis, delineate a pattern of disease progression, and resemble stages in neurogenesis. Cancer Cell 9(3):157-73.
